| |
SLAMD Generated Report | Version 2.0.1 |
| Job ID | 20100812212659-913960111-9 | |
| Optimizing Job ID | 20100812212659-913960111 | |
| Job Description | 2.6.35 (9 Threads) | |
| Job Type | LDAP SearchRate | |
| Job Class | com.slamd.jobs.LDAPSearchRateJobClass | |
| Job State | Stopped because the maximum duration had been reached |
| Scheduled Start Time | 08/12/2010 21:53:02 | |
| Scheduled Stop Time | (Not Specified) | |
| Scheduled Duration | 180 seconds | |
| Number of Clients | 8 | |
| Threads Per Client | 9 | |
| Thread Startup Delay | 0 milliseconds | |
| Statistics Collection Interval | 30 seconds |
| Server Addresses | ada:9011 | |
| Security Method | None | |
| Bind DN | cn=directory manager | |
| Bind Password | *** NOT DISPLAYED *** | |
| Search Base | dc=example,dc=com | |
| Search Scope | Whole Subtree | |
| Attributes to Return | cn description |
|
| Search Filter 1 | cn=user.[1-5000000] | |
| Search Filter 2 | objectclass=* | |
| Filter 1 Percentage | 100 | |
| Warm Up Time | 0 | |
| Cool Down Time | 0 | |
| Response Time Threshold (ms) | -1 | |
| Max Search Rate (Searches/Second/Client) | -1 | |
| Max Rate Enforcement Interval (Seconds) | 0 | |
| Size Limit | 0 | |
| Time Limit | 0 | |
| Time Between Requests (ms) | 0 |
| Actual Start Time | 08/12/2010 21:53:02 | |
| Actual Stop Time | 08/12/2010 21:56:03 | |
| Actual Duration | 180 seconds | |
| Clients Used |
sihu.symas.net:49305 dutar:40164 sihu.symas.net:49306 dutar:40169 sihu.symas.net:49307 dutar:40167 sihu.symas.net:49308 dutar:40170 |
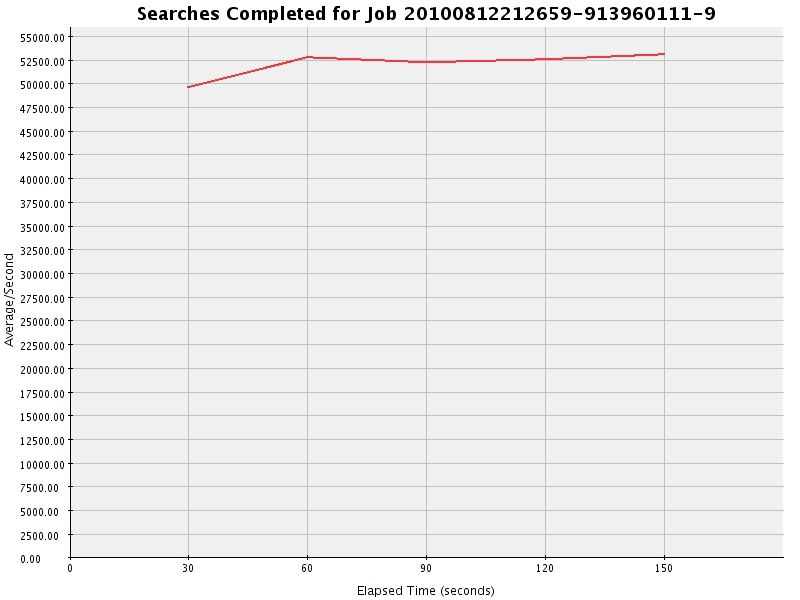
| Count | Avg/Second | Avg/Interval | Max/Interval | Min/Interval | Std Dev | Correlation Coefficient | Regression Equation | Horizontality T Score |
| 7804469 | 52029.793 | 1560893.800 | 1592629 | 1486730 | 1419.978 | -0.315 | y = 50672.560 + 22.621x | 0.875 |
| Interval | Occurrences | Avg/Second |
| 1 | 1486730 | 49557.667 |
| 2 | 1583571 | 52785.700 |
| 3 | 1566181 | 52206.033 |
| 4 | 1575358 | 52511.933 |
| 5 | 1592629 | 53087.633 |
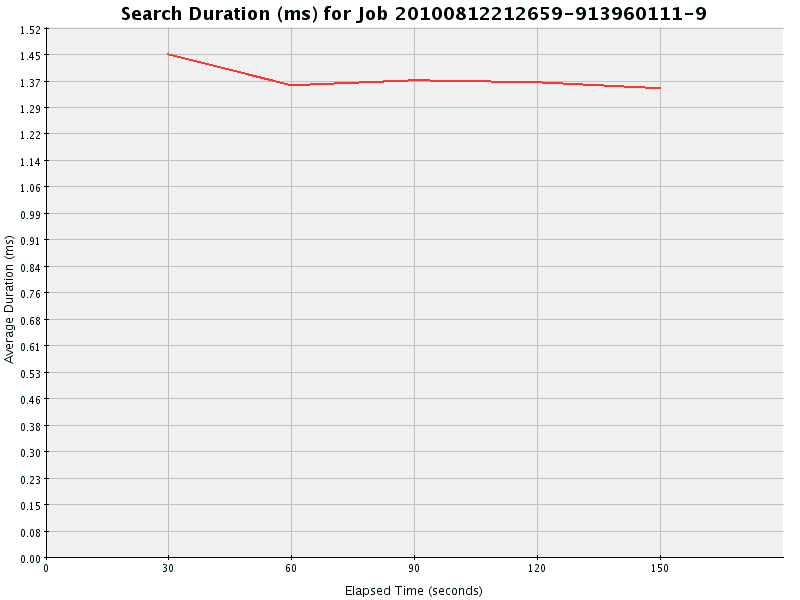
| Total Duration | Total Count | Avg Duration | Max Duration | Min Duration | Avg Count/Interval | Avg Duration/Interval | Std Dev | Correlation Coefficient | Regression Equation | Horizontality T Score |
| 10740776 | 7804494 | 1.376 | 105 | 0 | 1560898.800 | 2148155.200 | 0.039 | 0.333 | y = 1.414 - 0.001x | 0.259 |
| Interval | Total Duration | Count | Average Duration | Occurrences/Second |
| 1 | 2148773 | 1486761 | 1.445 | 49558.700 |
| 2 | 2147918 | 1583568 | 1.356 | 52785.600 |
| 3 | 2148015 | 1566163 | 1.372 | 52205.433 |
| 4 | 2148176 | 1575378 | 1.364 | 52512.600 |
| 5 | 2147894 | 1592624 | 1.349 | 53087.467 |
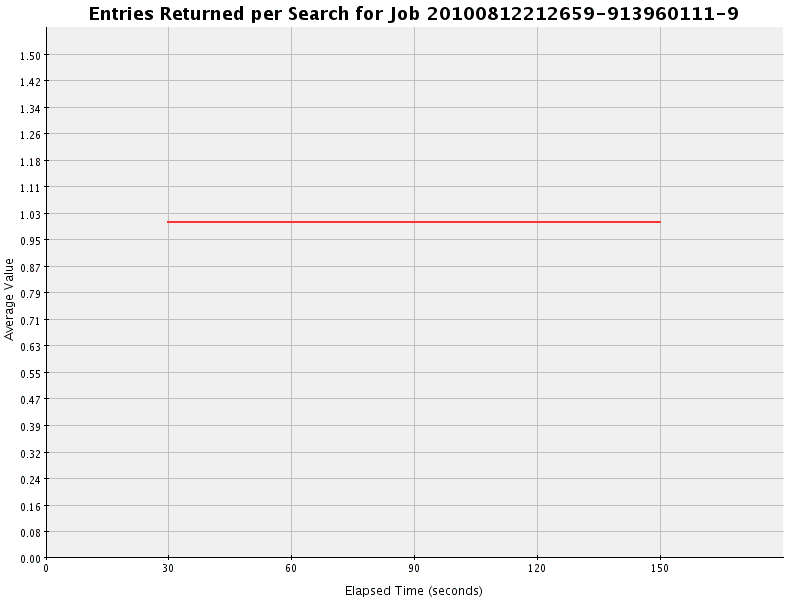
| Total | Avg Value | Max Value | Min Value | Avg/Second | Avg/Interval | Std Dev | Correlation Coefficient | Regression Equation | Horizontality T Score |
| 7804471 | 1.000 | 1 | 1 | 52029.807 | 1560894.200 | 0.000 | 0.000 | y = 1.000 + 0.000x | 0.243 |
| Interval | Total | Count | Average | Avg/Second |
| 1 | 1486731 | 1486731 | 1.000 | 49557.700 |
| 2 | 1583574 | 1583574 | 1.000 | 52785.800 |
| 3 | 1566177 | 1566177 | 1.000 | 52205.900 |
| 4 | 1575359 | 1575359 | 1.000 | 52511.967 |
| 5 | 1592630 | 1592630 | 1.000 | 53087.667 |
| Interval | success |
| Total | 9285226 (100.000%) |
| 0 | 1486733 (100.000) |
| 1 | 1583575 (100.000) |
| 2 | 1566175 (100.000) |
| 3 | 1575362 (100.000) |
| 4 | 1592629 (100.000) |
| 5 | 1480752 (100.000) |