| |
SLAMD Generated Report | Version 2.0.1 |
| Job ID | 20100812212659-913960111-8 | |
| Optimizing Job ID | 20100812212659-913960111 | |
| Job Description | 2.6.35 (8 Threads) | |
| Job Type | LDAP SearchRate | |
| Job Class | com.slamd.jobs.LDAPSearchRateJobClass | |
| Job State | Stopped because the maximum duration had been reached |
| Scheduled Start Time | 08/12/2010 21:49:47 | |
| Scheduled Stop Time | (Not Specified) | |
| Scheduled Duration | 180 seconds | |
| Number of Clients | 8 | |
| Threads Per Client | 8 | |
| Thread Startup Delay | 0 milliseconds | |
| Statistics Collection Interval | 30 seconds |
| Server Addresses | ada:9011 | |
| Security Method | None | |
| Bind DN | cn=directory manager | |
| Bind Password | *** NOT DISPLAYED *** | |
| Search Base | dc=example,dc=com | |
| Search Scope | Whole Subtree | |
| Attributes to Return | cn description |
|
| Search Filter 1 | cn=user.[1-5000000] | |
| Search Filter 2 | objectclass=* | |
| Filter 1 Percentage | 100 | |
| Warm Up Time | 0 | |
| Cool Down Time | 0 | |
| Response Time Threshold (ms) | -1 | |
| Max Search Rate (Searches/Second/Client) | -1 | |
| Max Rate Enforcement Interval (Seconds) | 0 | |
| Size Limit | 0 | |
| Time Limit | 0 | |
| Time Between Requests (ms) | 0 |
| Actual Start Time | 08/12/2010 21:49:47 | |
| Actual Stop Time | 08/12/2010 21:52:47 | |
| Actual Duration | 180 seconds | |
| Clients Used |
sihu.symas.net:49305 dutar:40164 sihu.symas.net:49306 dutar:40169 sihu.symas.net:49307 dutar:40167 sihu.symas.net:49308 dutar:40170 |
| Count | Avg/Second | Avg/Interval | Max/Interval | Min/Interval | Std Dev | Correlation Coefficient | Regression Equation | Horizontality T Score |
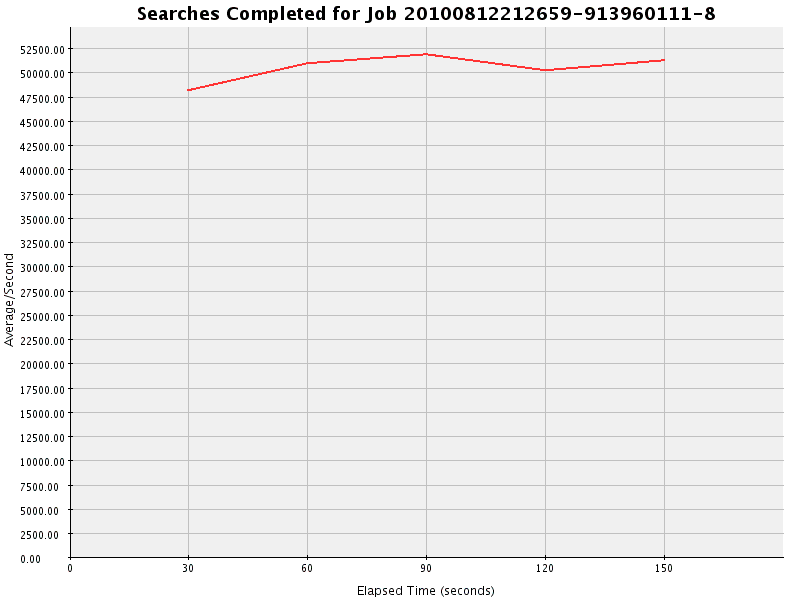
| 7577157 | 50514.380 | 1515431.400 | 1556923 | 1446271 | 1423.952 | -0.319 | y = 49448.773 + 17.760x | 1.032 |
| Interval | Occurrences | Avg/Second |
| 1 | 1446271 | 48209.033 |
| 2 | 1529753 | 50991.767 |
| 3 | 1556923 | 51897.433 |
| 4 | 1506284 | 50209.467 |
| 5 | 1537926 | 51264.200 |
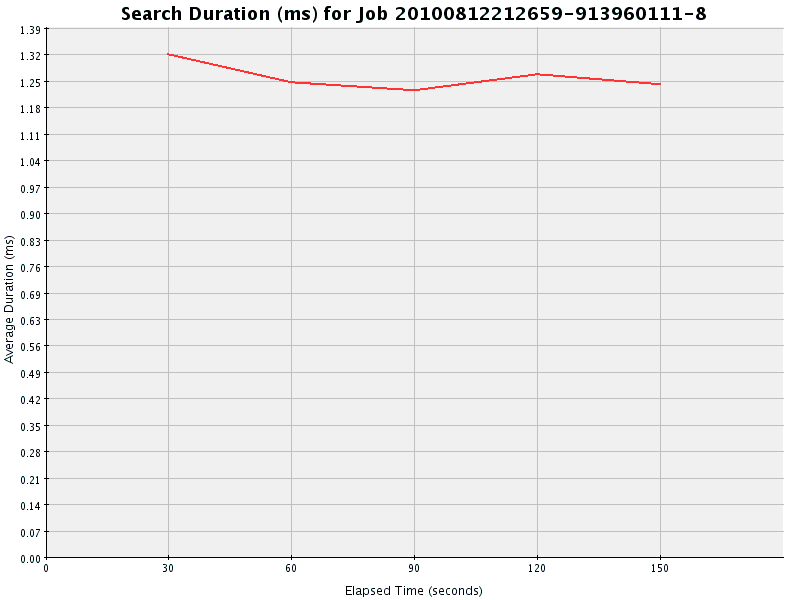
| Total Duration | Total Count | Avg Duration | Max Duration | Min Duration | Avg Count/Interval | Avg Duration/Interval | Std Dev | Correlation Coefficient | Regression Equation | Horizontality T Score |
| 9544030 | 7577185 | 1.260 | 96 | 0 | 1515437.000 | 1908806.000 | 0.037 | 0.333 | y = 1.288 - 0.000x | 0.260 |
| Interval | Total Duration | Count | Average Duration | Occurrences/Second |
| 1 | 1909328 | 1446291 | 1.320 | 48209.700 |
| 2 | 1908780 | 1529755 | 1.248 | 50991.833 |
| 3 | 1908399 | 1556935 | 1.226 | 51897.833 |
| 4 | 1908974 | 1506292 | 1.267 | 50209.733 |
| 5 | 1908549 | 1537912 | 1.241 | 51263.733 |
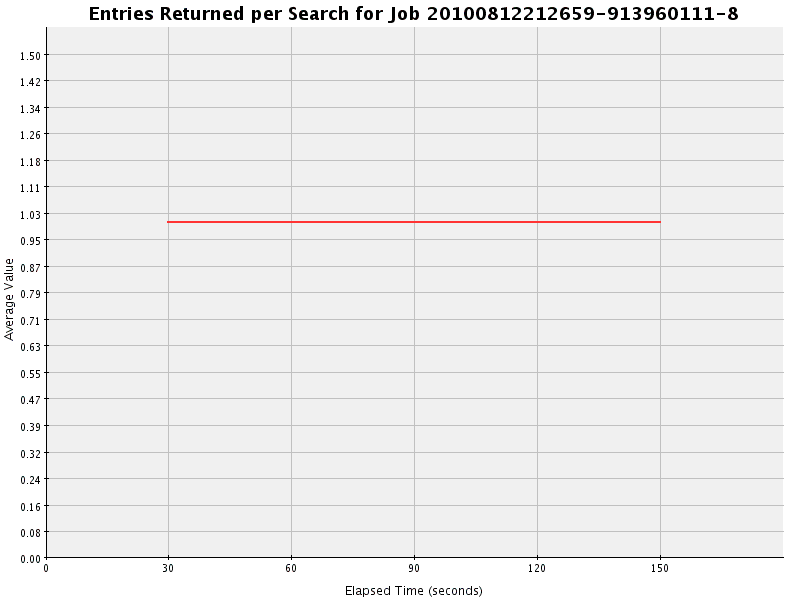
| Total | Avg Value | Max Value | Min Value | Avg/Second | Avg/Interval | Std Dev | Correlation Coefficient | Regression Equation | Horizontality T Score |
| 7577163 | 1.000 | 1 | 1 | 50514.420 | 1515432.600 | 0.000 | 0.000 | y = 1.000 + 0.000x | 0.243 |
| Interval | Total | Count | Average | Avg/Second |
| 1 | 1446275 | 1446275 | 1.000 | 48209.167 |
| 2 | 1529752 | 1529752 | 1.000 | 50991.733 |
| 3 | 1556925 | 1556925 | 1.000 | 51897.500 |
| 4 | 1506285 | 1506285 | 1.000 | 50209.500 |
| 5 | 1537926 | 1537926 | 1.000 | 51264.200 |
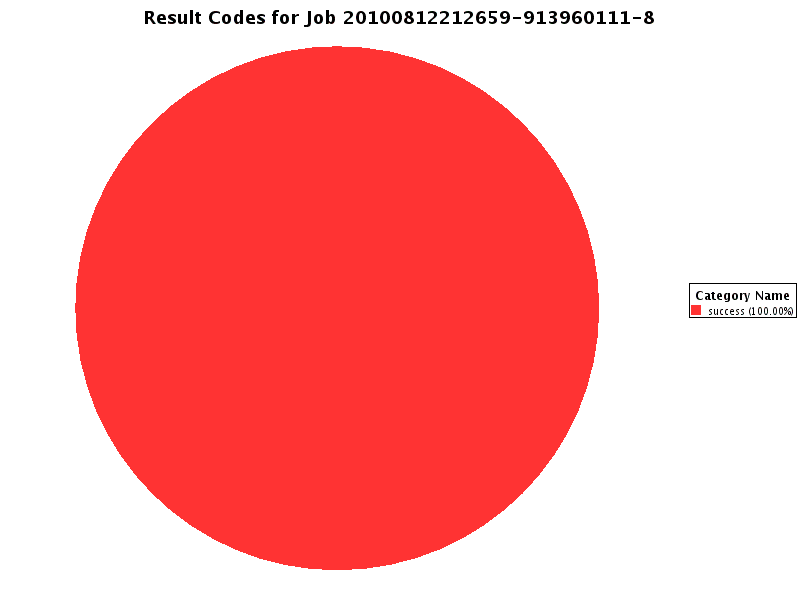
| Interval | success |
| Total | 8973208 (100.000%) |
| 0 | 1446290 (100.000) |
| 1 | 1529753 (100.000) |
| 2 | 1556922 (100.000) |
| 3 | 1506289 (100.000) |
| 4 | 1537914 (100.000) |
| 5 | 1396040 (100.000) |