| |
SLAMD Generated Report | Version 2.0.1 |
| Job ID | 20100812212659-913960111-6 | |
| Optimizing Job ID | 20100812212659-913960111 | |
| Job Description | 2.6.35 (6 Threads) | |
| Job Type | LDAP SearchRate | |
| Job Class | com.slamd.jobs.LDAPSearchRateJobClass | |
| Job State | Stopped because the maximum duration had been reached |
| Scheduled Start Time | 08/12/2010 21:43:16 | |
| Scheduled Stop Time | (Not Specified) | |
| Scheduled Duration | 180 seconds | |
| Number of Clients | 8 | |
| Threads Per Client | 6 | |
| Thread Startup Delay | 0 milliseconds | |
| Statistics Collection Interval | 30 seconds |
| Server Addresses | ada:9011 | |
| Security Method | None | |
| Bind DN | cn=directory manager | |
| Bind Password | *** NOT DISPLAYED *** | |
| Search Base | dc=example,dc=com | |
| Search Scope | Whole Subtree | |
| Attributes to Return | cn description |
|
| Search Filter 1 | cn=user.[1-5000000] | |
| Search Filter 2 | objectclass=* | |
| Filter 1 Percentage | 100 | |
| Warm Up Time | 0 | |
| Cool Down Time | 0 | |
| Response Time Threshold (ms) | -1 | |
| Max Search Rate (Searches/Second/Client) | -1 | |
| Max Rate Enforcement Interval (Seconds) | 0 | |
| Size Limit | 0 | |
| Time Limit | 0 | |
| Time Between Requests (ms) | 0 |
| Actual Start Time | 08/12/2010 21:43:16 | |
| Actual Stop Time | 08/12/2010 21:46:16 | |
| Actual Duration | 180 seconds | |
| Clients Used |
sihu.symas.net:49305 dutar:40164 sihu.symas.net:49306 dutar:40169 sihu.symas.net:49307 dutar:40167 sihu.symas.net:49308 dutar:40170 |
| Count | Avg/Second | Avg/Interval | Max/Interval | Min/Interval | Std Dev | Correlation Coefficient | Regression Equation | Horizontality T Score |
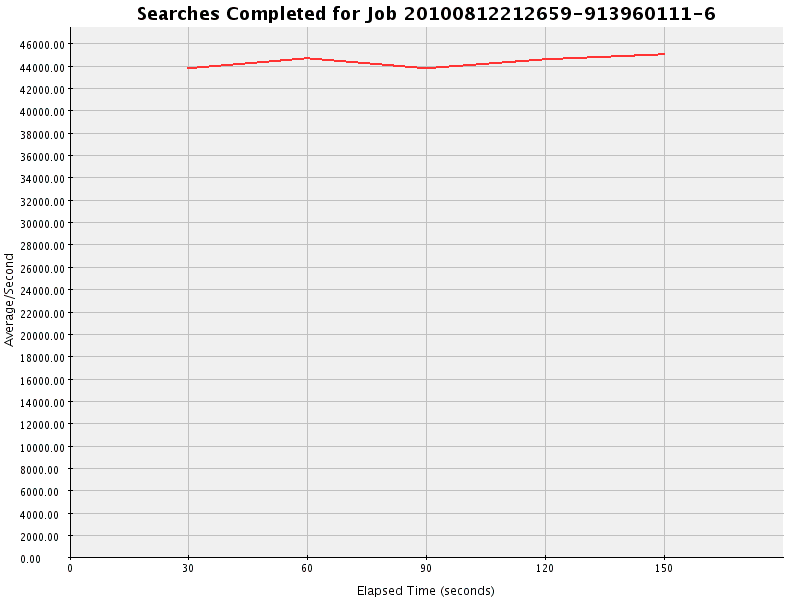
| 6657627 | 44384.180 | 1331525.400 | 1351206 | 1314137 | 548.639 | -0.326 | y = 43919.147 + 7.751x | 0.389 |
| Interval | Occurrences | Avg/Second |
| 1 | 1314137 | 43804.567 |
| 2 | 1340938 | 44697.933 |
| 3 | 1314791 | 43826.367 |
| 4 | 1336555 | 44551.833 |
| 5 | 1351206 | 45040.200 |
| Total Duration | Total Count | Avg Duration | Max Duration | Min Duration | Avg Count/Interval | Avg Duration/Interval | Std Dev | Correlation Coefficient | Regression Equation | Horizontality T Score |
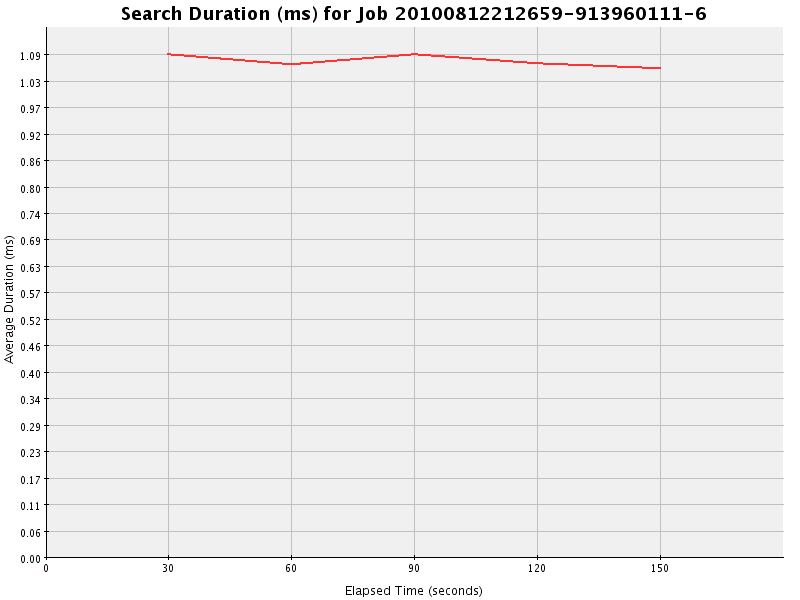
| 7153567 | 6657648 | 1.074 | 80 | 0 | 1331529.600 | 1430713.400 | 0.013 | 0.333 | y = 1.086 - 0.000x | 0.245 |
| Interval | Total Duration | Count | Average Duration | Occurrences/Second |
| 1 | 1430832 | 1314157 | 1.089 | 43805.233 |
| 2 | 1430646 | 1340940 | 1.067 | 44698.000 |
| 3 | 1430853 | 1314790 | 1.088 | 43826.333 |
| 4 | 1430521 | 1336537 | 1.070 | 44551.233 |
| 5 | 1430715 | 1351224 | 1.059 | 45040.800 |
| Total | Avg Value | Max Value | Min Value | Avg/Second | Avg/Interval | Std Dev | Correlation Coefficient | Regression Equation | Horizontality T Score |
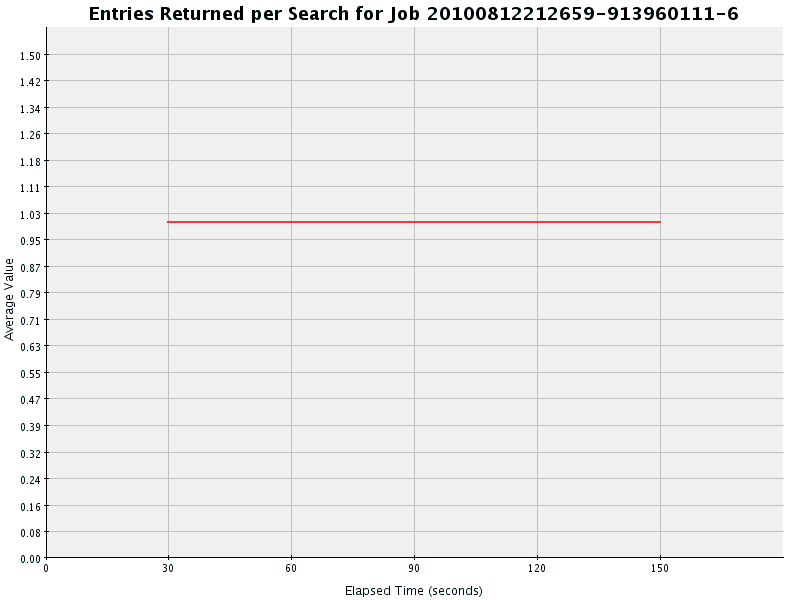
| 6657629 | 1.000 | 1 | 1 | 44384.193 | 1331525.800 | 0.000 | 0.000 | y = 1.000 + 0.000x | 0.243 |
| Interval | Total | Count | Average | Avg/Second |
| 1 | 1314140 | 1314140 | 1.000 | 43804.667 |
| 2 | 1340939 | 1340939 | 1.000 | 44697.967 |
| 3 | 1314789 | 1314789 | 1.000 | 43826.300 |
| 4 | 1336553 | 1336553 | 1.000 | 44551.767 |
| 5 | 1351208 | 1351208 | 1.000 | 45040.267 |
| Interval | success |
| Total | 7968418 (100.000%) |
| 0 | 1314140 (100.000) |
| 1 | 1340939 (100.000) |
| 2 | 1314789 (100.000) |
| 3 | 1336553 (100.000) |
| 4 | 1351208 (100.000) |
| 5 | 1310789 (100.000) |