| |
SLAMD Generated Report | Version 2.0.1 |
| Job ID | 20100812212659-913960111-28 | |
| Optimizing Job ID | 20100812212659-913960111 | |
| Job Description | 2.6.35 (28 Threads) | |
| Job Type | LDAP SearchRate | |
| Job Class | com.slamd.jobs.LDAPSearchRateJobClass | |
| Job State | Stopped because the maximum duration had been reached |
| Scheduled Start Time | 08/12/2010 22:55:13 | |
| Scheduled Stop Time | (Not Specified) | |
| Scheduled Duration | 180 seconds | |
| Number of Clients | 8 | |
| Threads Per Client | 28 | |
| Thread Startup Delay | 0 milliseconds | |
| Statistics Collection Interval | 30 seconds |
| Server Addresses | ada:9011 | |
| Security Method | None | |
| Bind DN | cn=directory manager | |
| Bind Password | *** NOT DISPLAYED *** | |
| Search Base | dc=example,dc=com | |
| Search Scope | Whole Subtree | |
| Attributes to Return | cn description |
|
| Search Filter 1 | cn=user.[1-5000000] | |
| Search Filter 2 | objectclass=* | |
| Filter 1 Percentage | 100 | |
| Warm Up Time | 0 | |
| Cool Down Time | 0 | |
| Response Time Threshold (ms) | -1 | |
| Max Search Rate (Searches/Second/Client) | -1 | |
| Max Rate Enforcement Interval (Seconds) | 0 | |
| Size Limit | 0 | |
| Time Limit | 0 | |
| Time Between Requests (ms) | 0 |
| Actual Start Time | 08/12/2010 22:55:13 | |
| Actual Stop Time | 08/12/2010 22:58:15 | |
| Actual Duration | 180 seconds | |
| Clients Used |
sihu.symas.net:49305 dutar:40164 sihu.symas.net:49306 dutar:40169 sihu.symas.net:49307 dutar:40167 sihu.symas.net:49308 dutar:40170 |
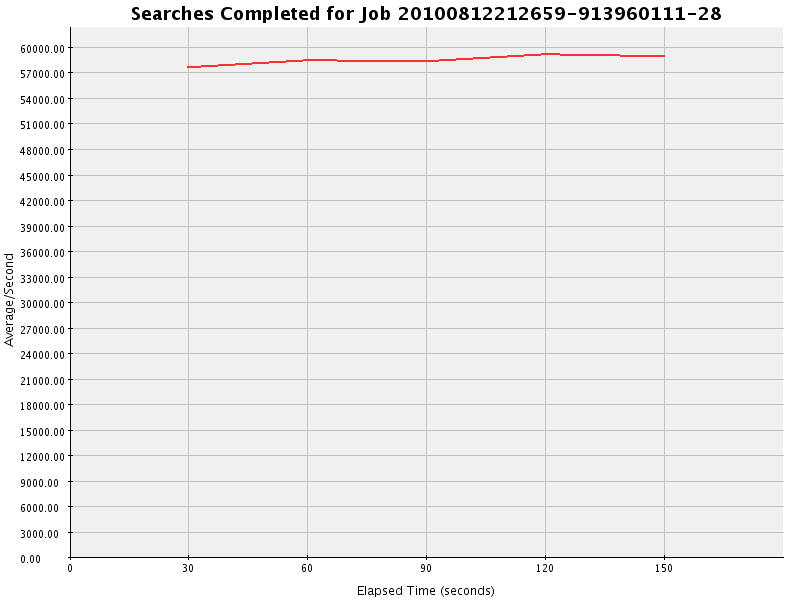
| Count | Avg/Second | Avg/Interval | Max/Interval | Min/Interval | Std Dev | Correlation Coefficient | Regression Equation | Horizontality T Score |
| 8776809 | 58512.060 | 1755361.800 | 1774948 | 1729470 | 594.213 | -0.325 | y = 57833.240 + 11.314x | 1.778 |
| Interval | Occurrences | Avg/Second |
| 1 | 1729470 | 57649.000 |
| 2 | 1752369 | 58412.300 |
| 3 | 1750930 | 58364.333 |
| 4 | 1774948 | 59164.933 |
| 5 | 1769092 | 58969.733 |
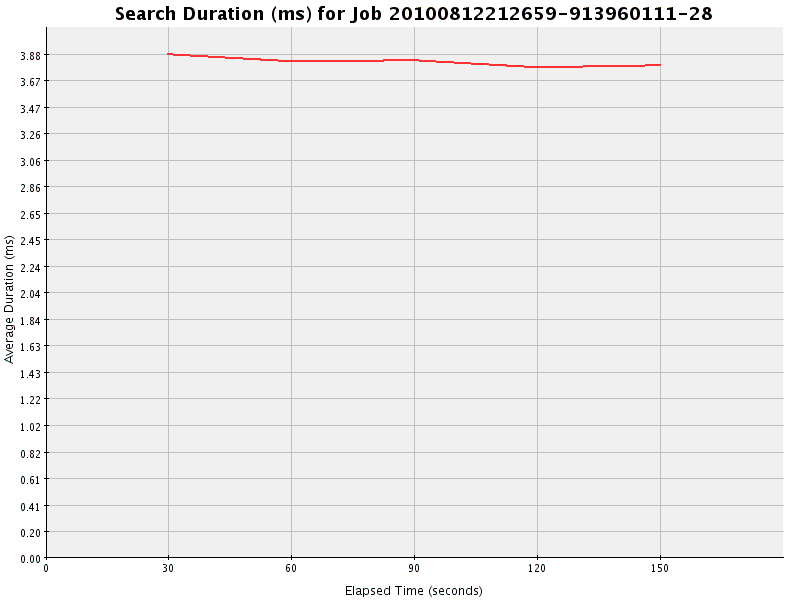
| Total Duration | Total Count | Avg Duration | Max Duration | Min Duration | Avg Count/Interval | Avg Duration/Interval | Std Dev | Correlation Coefficient | Regression Equation | Horizontality T Score |
| 33523657 | 8776834 | 3.820 | 227 | 0 | 1755366.800 | 6704731.400 | 0.039 | 0.333 | y = 3.864 - 0.001x | 0.251 |
| Interval | Total Duration | Count | Average Duration | Occurrences/Second |
| 1 | 6704748 | 1729507 | 3.877 | 57650.233 |
| 2 | 6704870 | 1752376 | 3.826 | 58412.533 |
| 3 | 6704889 | 1750921 | 3.829 | 58364.033 |
| 4 | 6704304 | 1774931 | 3.777 | 59164.367 |
| 5 | 6704846 | 1769099 | 3.790 | 58969.967 |
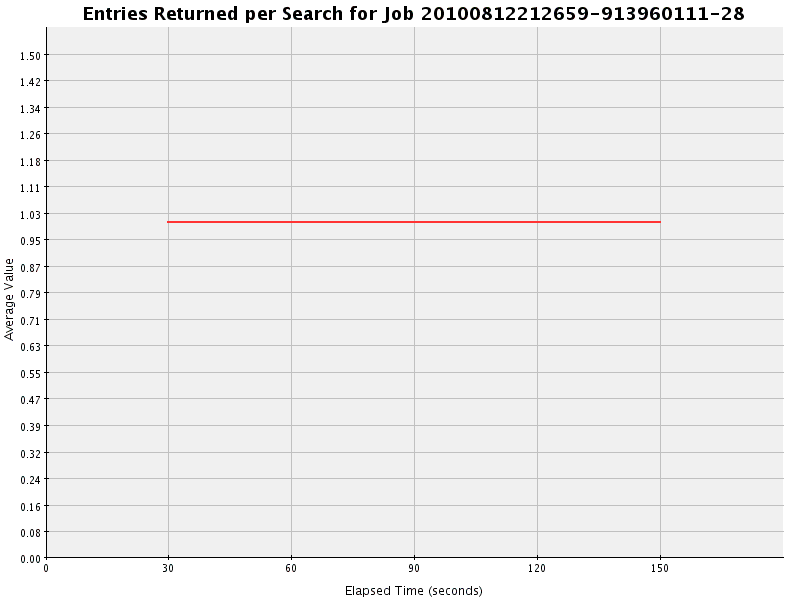
| Total | Avg Value | Max Value | Min Value | Avg/Second | Avg/Interval | Std Dev | Correlation Coefficient | Regression Equation | Horizontality T Score |
| 8776811 | 1.000 | 1 | 1 | 58512.073 | 1755362.200 | 0.000 | 0.000 | y = 1.000 + 0.000x | 0.243 |
| Interval | Total | Count | Average | Avg/Second |
| 1 | 1729477 | 1729477 | 1.000 | 57649.233 |
| 2 | 1752367 | 1752367 | 1.000 | 58412.233 |
| 3 | 1750931 | 1750931 | 1.000 | 58364.367 |
| 4 | 1774946 | 1774946 | 1.000 | 59164.867 |
| 5 | 1769090 | 1769090 | 1.000 | 58969.667 |
| Interval | success |
| Total | 10545162 (100.000%) |
| 0 | 1729477 (100.000) |
| 1 | 1752369 (100.000) |
| 2 | 1750930 (100.000) |
| 3 | 1774945 (100.000) |
| 4 | 1769090 (100.000) |
| 5 | 1768351 (100.000) |