| |
SLAMD Generated Report | Version 2.0.1 |
| Job ID | 20100812212659-913960111-23 | |
| Optimizing Job ID | 20100812212659-913960111 | |
| Job Description | 2.6.35 (23 Threads) | |
| Job Type | LDAP SearchRate | |
| Job Class | com.slamd.jobs.LDAPSearchRateJobClass | |
| Job State | Stopped because the maximum duration had been reached |
| Scheduled Start Time | 08/12/2010 22:38:48 | |
| Scheduled Stop Time | (Not Specified) | |
| Scheduled Duration | 180 seconds | |
| Number of Clients | 8 | |
| Threads Per Client | 23 | |
| Thread Startup Delay | 0 milliseconds | |
| Statistics Collection Interval | 30 seconds |
| Server Addresses | ada:9011 | |
| Security Method | None | |
| Bind DN | cn=directory manager | |
| Bind Password | *** NOT DISPLAYED *** | |
| Search Base | dc=example,dc=com | |
| Search Scope | Whole Subtree | |
| Attributes to Return | cn description |
|
| Search Filter 1 | cn=user.[1-5000000] | |
| Search Filter 2 | objectclass=* | |
| Filter 1 Percentage | 100 | |
| Warm Up Time | 0 | |
| Cool Down Time | 0 | |
| Response Time Threshold (ms) | -1 | |
| Max Search Rate (Searches/Second/Client) | -1 | |
| Max Rate Enforcement Interval (Seconds) | 0 | |
| Size Limit | 0 | |
| Time Limit | 0 | |
| Time Between Requests (ms) | 0 |
| Actual Start Time | 08/12/2010 22:38:48 | |
| Actual Stop Time | 08/12/2010 22:41:49 | |
| Actual Duration | 180 seconds | |
| Clients Used |
sihu.symas.net:49305 dutar:40164 sihu.symas.net:49306 dutar:40169 sihu.symas.net:49307 dutar:40167 sihu.symas.net:49308 dutar:40170 |
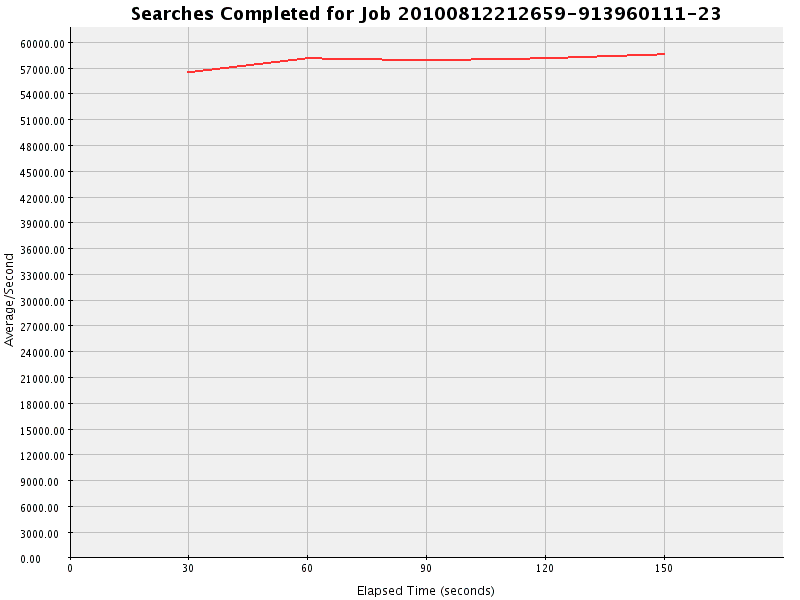
| Count | Avg/Second | Avg/Interval | Max/Interval | Min/Interval | Std Dev | Correlation Coefficient | Regression Equation | Horizontality T Score |
| 8675690 | 57837.933 | 1735138.000 | 1757536 | 1693885 | 812.376 | -0.323 | y = 56991.327 + 14.110x | 1.014 |
| Interval | Occurrences | Avg/Second |
| 1 | 1693885 | 56462.833 |
| 2 | 1744573 | 58152.433 |
| 3 | 1735434 | 57847.800 |
| 4 | 1744262 | 58142.067 |
| 5 | 1757536 | 58584.533 |
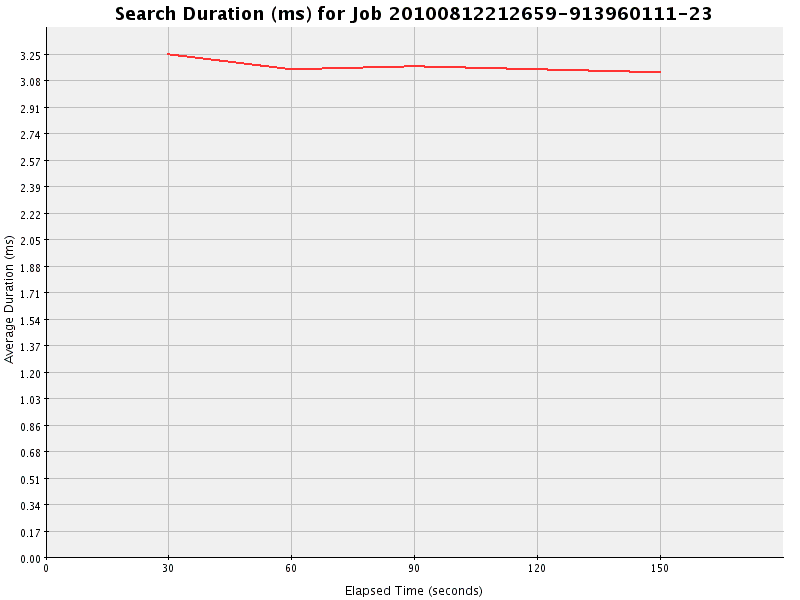
| Total Duration | Total Count | Avg Duration | Max Duration | Min Duration | Avg Count/Interval | Avg Duration/Interval | Std Dev | Correlation Coefficient | Regression Equation | Horizontality T Score |
| 27527169 | 8675728 | 3.173 | 225 | 0 | 1735145.600 | 5505433.800 | 0.045 | 0.333 | y = 3.220 - 0.001x | 0.252 |
| Interval | Total Duration | Count | Average Duration | Occurrences/Second |
| 1 | 5505640 | 1693928 | 3.250 | 56464.267 |
| 2 | 5505430 | 1744559 | 3.156 | 58151.967 |
| 3 | 5505563 | 1735441 | 3.172 | 57848.033 |
| 4 | 5505342 | 1744254 | 3.156 | 58141.800 |
| 5 | 5505194 | 1757546 | 3.132 | 58584.867 |
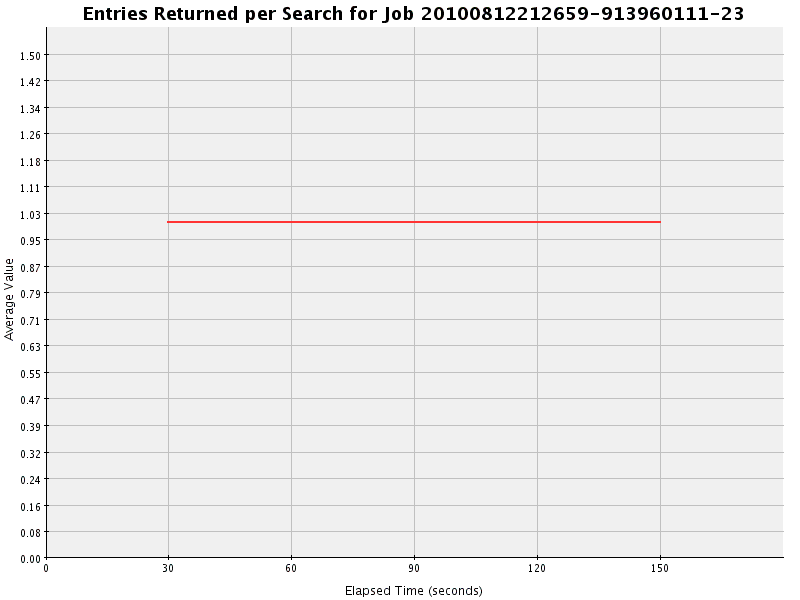
| Total | Avg Value | Max Value | Min Value | Avg/Second | Avg/Interval | Std Dev | Correlation Coefficient | Regression Equation | Horizontality T Score |
| 8675692 | 1.000 | 1 | 1 | 57837.947 | 1735138.400 | 0.000 | 0.000 | y = 1.000 + 0.000x | 0.243 |
| Interval | Total | Count | Average | Avg/Second |
| 1 | 1693885 | 1693885 | 1.000 | 56462.833 |
| 2 | 1744576 | 1744576 | 1.000 | 58152.533 |
| 3 | 1735433 | 1735433 | 1.000 | 57847.767 |
| 4 | 1744260 | 1744260 | 1.000 | 58142.000 |
| 5 | 1757538 | 1757538 | 1.000 | 58584.600 |
| Interval | success |
| Total | 10440764 (100.000%) |
| 0 | 1693885 (100.000) |
| 1 | 1744578 (100.000) |
| 2 | 1735431 (100.000) |
| 3 | 1744261 (100.000) |
| 4 | 1757539 (100.000) |
| 5 | 1765070 (100.000) |