| |
SLAMD Generated Report | Version 2.0.1 |
| Job ID | 20100812212659-913960111-19 | |
| Optimizing Job ID | 20100812212659-913960111 | |
| Job Description | 2.6.35 (19 Threads) | |
| Job Type | LDAP SearchRate | |
| Job Class | com.slamd.jobs.LDAPSearchRateJobClass | |
| Job State | Stopped because the maximum duration had been reached |
| Scheduled Start Time | 08/12/2010 22:25:42 | |
| Scheduled Stop Time | (Not Specified) | |
| Scheduled Duration | 180 seconds | |
| Number of Clients | 8 | |
| Threads Per Client | 19 | |
| Thread Startup Delay | 0 milliseconds | |
| Statistics Collection Interval | 30 seconds |
| Server Addresses | ada:9011 | |
| Security Method | None | |
| Bind DN | cn=directory manager | |
| Bind Password | *** NOT DISPLAYED *** | |
| Search Base | dc=example,dc=com | |
| Search Scope | Whole Subtree | |
| Attributes to Return | cn description |
|
| Search Filter 1 | cn=user.[1-5000000] | |
| Search Filter 2 | objectclass=* | |
| Filter 1 Percentage | 100 | |
| Warm Up Time | 0 | |
| Cool Down Time | 0 | |
| Response Time Threshold (ms) | -1 | |
| Max Search Rate (Searches/Second/Client) | -1 | |
| Max Rate Enforcement Interval (Seconds) | 0 | |
| Size Limit | 0 | |
| Time Limit | 0 | |
| Time Between Requests (ms) | 0 |
| Actual Start Time | 08/12/2010 22:25:42 | |
| Actual Stop Time | 08/12/2010 22:28:43 | |
| Actual Duration | 180 seconds | |
| Clients Used |
sihu.symas.net:49305 dutar:40164 sihu.symas.net:49306 dutar:40169 sihu.symas.net:49307 dutar:40167 sihu.symas.net:49308 dutar:40170 |
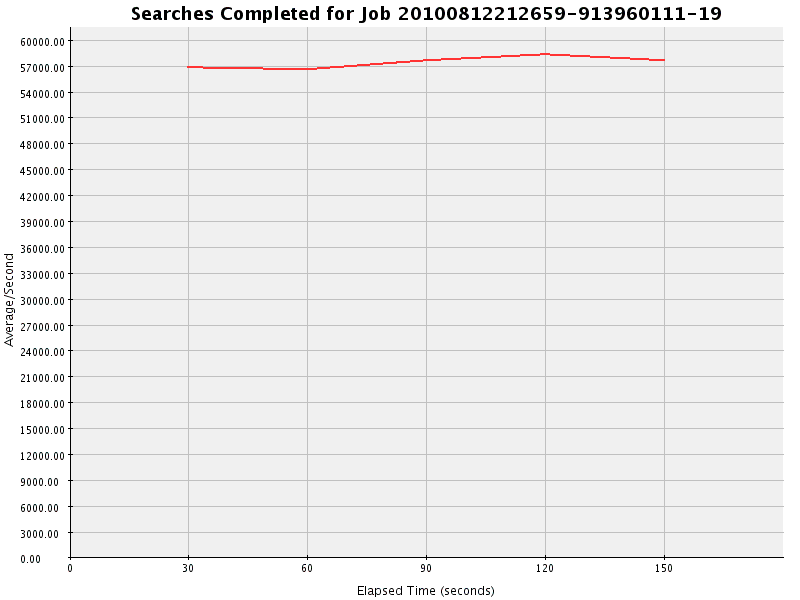
| Count | Avg/Second | Avg/Interval | Max/Interval | Min/Interval | Std Dev | Correlation Coefficient | Regression Equation | Horizontality T Score |
| 8607996 | 57386.640 | 1721599.200 | 1750473 | 1696647 | 722.711 | -0.325 | y = 56695.680 + 11.516x | 4.443 |
| Interval | Occurrences | Avg/Second |
| 1 | 1703582 | 56786.067 |
| 2 | 1696647 | 56554.900 |
| 3 | 1728803 | 57626.767 |
| 4 | 1750473 | 58349.100 |
| 5 | 1728491 | 57616.367 |
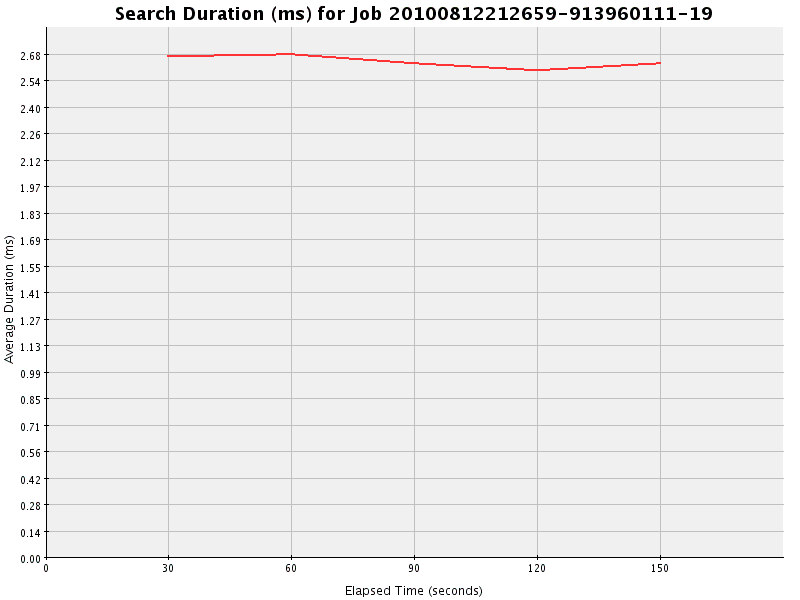
| Total Duration | Total Count | Avg Duration | Max Duration | Min Duration | Avg Count/Interval | Avg Duration/Interval | Std Dev | Correlation Coefficient | Regression Equation | Horizontality T Score |
| 22729572 | 8608023 | 2.641 | 224 | 0 | 1721604.600 | 4545914.400 | 0.033 | 0.333 | y = 2.673 - 0.001x | 0.255 |
| Interval | Total Duration | Count | Average Duration | Occurrences/Second |
| 1 | 4545185 | 1703615 | 2.668 | 56787.167 |
| 2 | 4546908 | 1696648 | 2.680 | 56554.933 |
| 3 | 4545889 | 1728791 | 2.630 | 57626.367 |
| 4 | 4545687 | 1750477 | 2.597 | 58349.233 |
| 5 | 4545903 | 1728492 | 2.630 | 57616.400 |
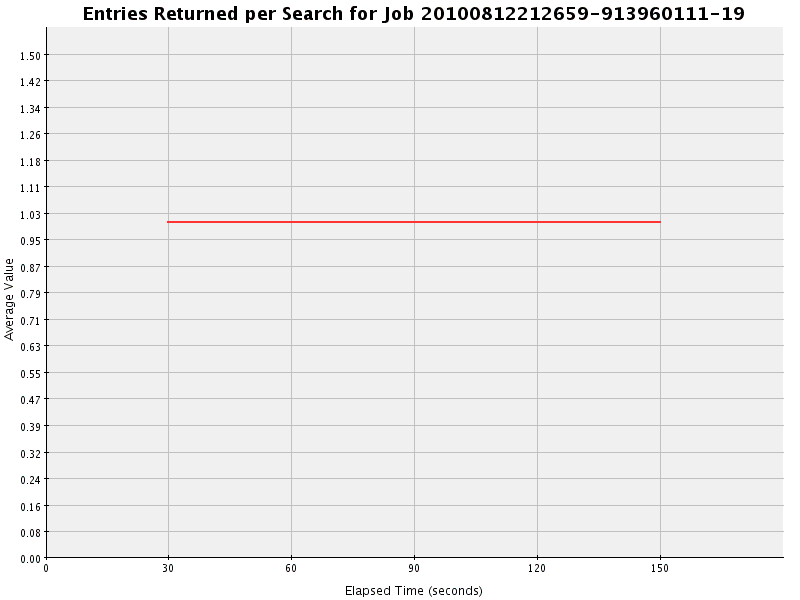
| Total | Avg Value | Max Value | Min Value | Avg/Second | Avg/Interval | Std Dev | Correlation Coefficient | Regression Equation | Horizontality T Score |
| 8608000 | 1.000 | 1 | 1 | 57386.667 | 1721600.000 | 0.000 | 0.000 | y = 1.000 + 0.000x | 0.243 |
| Interval | Total | Count | Average | Avg/Second |
| 1 | 1703586 | 1703586 | 1.000 | 56786.200 |
| 2 | 1696647 | 1696647 | 1.000 | 56554.900 |
| 3 | 1728801 | 1728801 | 1.000 | 57626.700 |
| 4 | 1750473 | 1750473 | 1.000 | 58349.100 |
| 5 | 1728493 | 1728493 | 1.000 | 57616.433 |
| Interval | success |
| Total | 10340624 (100.000%) |
| 0 | 1703586 (100.000) |
| 1 | 1696647 (100.000) |
| 2 | 1728801 (100.000) |
| 3 | 1750473 (100.000) |
| 4 | 1728493 (100.000) |
| 5 | 1732624 (100.000) |