| |
SLAMD Generated Report | Version 2.0.1 |
| Job ID | 20100812212659-913960111-15 | |
| Optimizing Job ID | 20100812212659-913960111 | |
| Job Description | 2.6.35 (15 Threads) | |
| Job Type | LDAP SearchRate | |
| Job Class | com.slamd.jobs.LDAPSearchRateJobClass | |
| Job State | Stopped because the maximum duration had been reached |
| Scheduled Start Time | 08/12/2010 22:12:37 | |
| Scheduled Stop Time | (Not Specified) | |
| Scheduled Duration | 180 seconds | |
| Number of Clients | 8 | |
| Threads Per Client | 15 | |
| Thread Startup Delay | 0 milliseconds | |
| Statistics Collection Interval | 30 seconds |
| Server Addresses | ada:9011 | |
| Security Method | None | |
| Bind DN | cn=directory manager | |
| Bind Password | *** NOT DISPLAYED *** | |
| Search Base | dc=example,dc=com | |
| Search Scope | Whole Subtree | |
| Attributes to Return | cn description |
|
| Search Filter 1 | cn=user.[1-5000000] | |
| Search Filter 2 | objectclass=* | |
| Filter 1 Percentage | 100 | |
| Warm Up Time | 0 | |
| Cool Down Time | 0 | |
| Response Time Threshold (ms) | -1 | |
| Max Search Rate (Searches/Second/Client) | -1 | |
| Max Rate Enforcement Interval (Seconds) | 0 | |
| Size Limit | 0 | |
| Time Limit | 0 | |
| Time Between Requests (ms) | 0 |
| Actual Start Time | 08/12/2010 22:12:37 | |
| Actual Stop Time | 08/12/2010 22:15:38 | |
| Actual Duration | 180 seconds | |
| Clients Used |
sihu.symas.net:49305 dutar:40164 sihu.symas.net:49306 dutar:40169 sihu.symas.net:49307 dutar:40167 sihu.symas.net:49308 dutar:40170 |
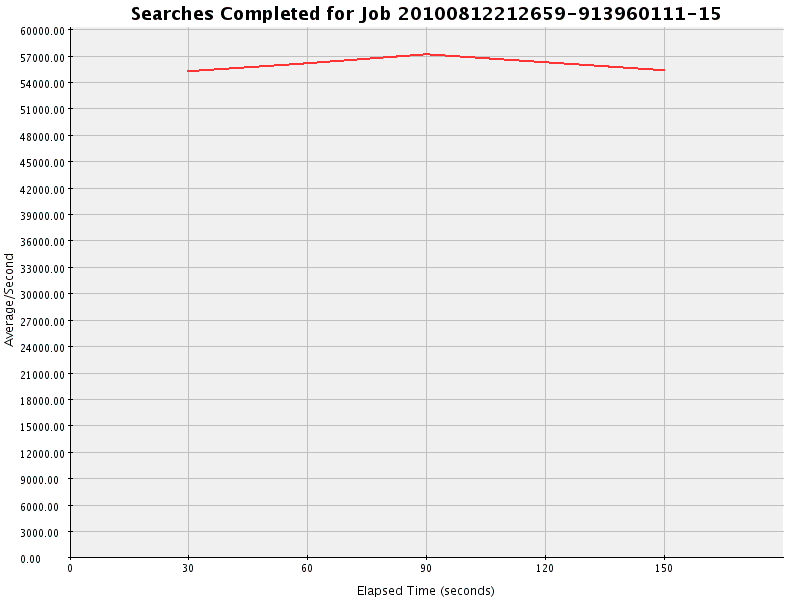
| Count | Avg/Second | Avg/Interval | Max/Interval | Min/Interval | Std Dev | Correlation Coefficient | Regression Equation | Horizontality T Score |
| 8403316 | 56022.107 | 1680663.200 | 1715179 | 1656753 | 773.571 | -0.332 | y = 55934.367 + 1.462x | 0.872 |
| Interval | Occurrences | Avg/Second |
| 1 | 1656753 | 55225.100 |
| 2 | 1683291 | 56109.700 |
| 3 | 1715179 | 57172.633 |
| 4 | 1686228 | 56207.600 |
| 5 | 1661865 | 55395.500 |
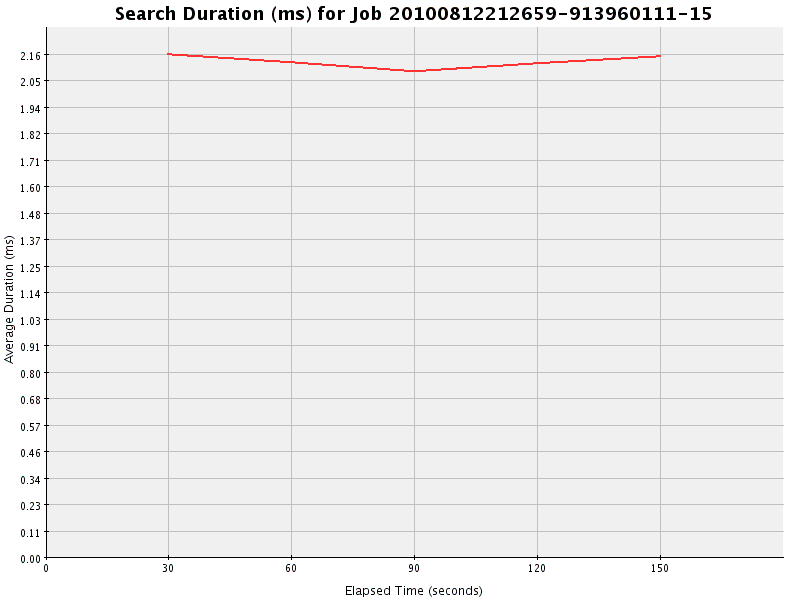
| Total Duration | Total Count | Avg Duration | Max Duration | Min Duration | Avg Count/Interval | Avg Duration/Interval | Std Dev | Correlation Coefficient | Regression Equation | Horizontality T Score |
| 17932967 | 8403343 | 2.134 | 85 | 0 | 1680668.600 | 3586593.400 | 0.029 | 0.333 | y = 2.138 - 0.000x | 0.249 |
| Interval | Total Duration | Count | Average Duration | Occurrences/Second |
| 1 | 3586723 | 1656782 | 2.165 | 55226.067 |
| 2 | 3586524 | 1683285 | 2.131 | 56109.500 |
| 3 | 3586388 | 1715188 | 2.091 | 57172.933 |
| 4 | 3586636 | 1686222 | 2.127 | 56207.400 |
| 5 | 3586696 | 1661866 | 2.158 | 55395.533 |
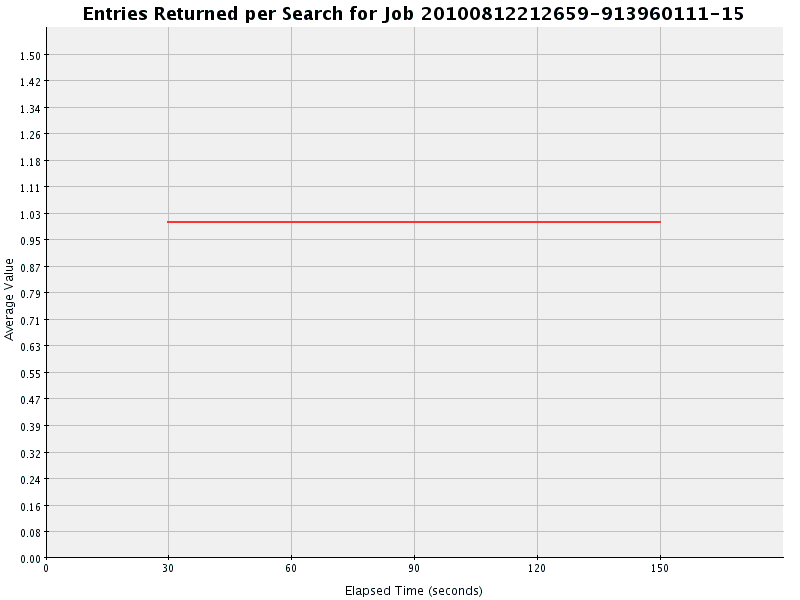
| Total | Avg Value | Max Value | Min Value | Avg/Second | Avg/Interval | Std Dev | Correlation Coefficient | Regression Equation | Horizontality T Score |
| 8403319 | 1.000 | 1 | 1 | 56022.127 | 1680663.800 | 0.000 | 0.000 | y = 1.000 + 0.000x | 0.243 |
| Interval | Total | Count | Average | Avg/Second |
| 1 | 1656754 | 1656754 | 1.000 | 55225.133 |
| 2 | 1683290 | 1683290 | 1.000 | 56109.667 |
| 3 | 1715182 | 1715182 | 1.000 | 57172.733 |
| 4 | 1686228 | 1686228 | 1.000 | 56207.600 |
| 5 | 1661865 | 1661865 | 1.000 | 55395.500 |
| Interval | success |
| Total | 10116497 (100.000%) |
| 0 | 1656756 (100.000) |
| 1 | 1683288 (100.000) |
| 2 | 1715183 (100.000) |
| 3 | 1686229 (100.000) |
| 4 | 1661864 (100.000) |
| 5 | 1713177 (100.000) |