| |
SLAMD Generated Report | Version 2.0.1 |
| Job ID | 20100812212659-913960111-10 | |
| Optimizing Job ID | 20100812212659-913960111 | |
| Job Description | 2.6.35 (10 Threads) | |
| Job Type | LDAP SearchRate | |
| Job Class | com.slamd.jobs.LDAPSearchRateJobClass | |
| Job State | Stopped because the maximum duration had been reached |
| Scheduled Start Time | 08/12/2010 21:56:18 | |
| Scheduled Stop Time | (Not Specified) | |
| Scheduled Duration | 180 seconds | |
| Number of Clients | 8 | |
| Threads Per Client | 10 | |
| Thread Startup Delay | 0 milliseconds | |
| Statistics Collection Interval | 30 seconds |
| Server Addresses | ada:9011 | |
| Security Method | None | |
| Bind DN | cn=directory manager | |
| Bind Password | *** NOT DISPLAYED *** | |
| Search Base | dc=example,dc=com | |
| Search Scope | Whole Subtree | |
| Attributes to Return | cn description |
|
| Search Filter 1 | cn=user.[1-5000000] | |
| Search Filter 2 | objectclass=* | |
| Filter 1 Percentage | 100 | |
| Warm Up Time | 0 | |
| Cool Down Time | 0 | |
| Response Time Threshold (ms) | -1 | |
| Max Search Rate (Searches/Second/Client) | -1 | |
| Max Rate Enforcement Interval (Seconds) | 0 | |
| Size Limit | 0 | |
| Time Limit | 0 | |
| Time Between Requests (ms) | 0 |
| Actual Start Time | 08/12/2010 21:56:18 | |
| Actual Stop Time | 08/12/2010 21:59:19 | |
| Actual Duration | 180 seconds | |
| Clients Used |
sihu.symas.net:49305 dutar:40164 sihu.symas.net:49306 dutar:40169 sihu.symas.net:49307 dutar:40167 sihu.symas.net:49308 dutar:40170 |
| Count | Avg/Second | Avg/Interval | Max/Interval | Min/Interval | Std Dev | Correlation Coefficient | Regression Equation | Horizontality T Score |
| 7968417 | 53122.780 | 1593683.400 | 1630551 | 1534628 | 1236.294 | -0.324 | y = 52435.580 + 11.453x | 0.379 |
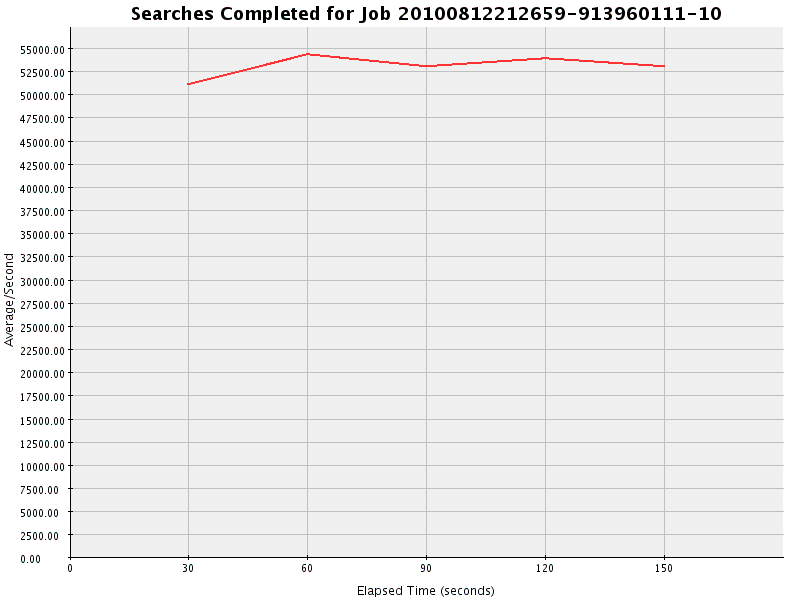
| Interval | Occurrences | Avg/Second |
| 1 | 1534628 | 51154.267 |
| 2 | 1630551 | 54351.700 |
| 3 | 1592205 | 53073.500 |
| 4 | 1619179 | 53972.633 |
| 5 | 1591854 | 53061.800 |
| Total Duration | Total Count | Avg Duration | Max Duration | Min Duration | Avg Count/Interval | Avg Duration/Interval | Std Dev | Correlation Coefficient | Regression Equation | Horizontality T Score |
| 11938749 | 7968453 | 1.498 | 111 | 0 | 1593690.600 | 2387749.800 | 0.036 | 0.333 | y = 1.519 - 0.000x | 0.249 |
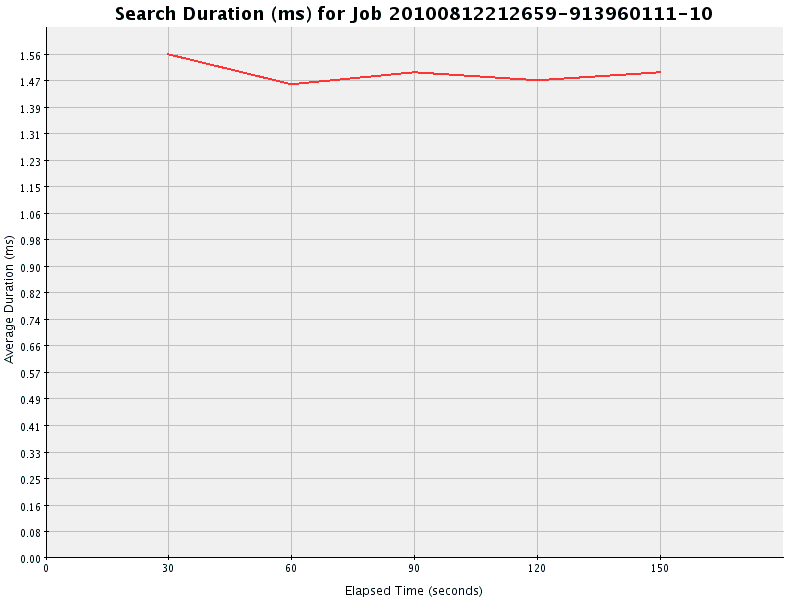
| Interval | Total Duration | Count | Average Duration | Occurrences/Second |
| 1 | 2388231 | 1534660 | 1.556 | 51155.333 |
| 2 | 2387434 | 1630552 | 1.464 | 54351.733 |
| 3 | 2387792 | 1592213 | 1.500 | 53073.767 |
| 4 | 2387498 | 1619176 | 1.475 | 53972.533 |
| 5 | 2387794 | 1591852 | 1.500 | 53061.733 |
| Total | Avg Value | Max Value | Min Value | Avg/Second | Avg/Interval | Std Dev | Correlation Coefficient | Regression Equation | Horizontality T Score |
| 7968430 | 1.000 | 1 | 1 | 53122.867 | 1593686.000 | 0.000 | 0.000 | y = 1.000 + 0.000x | 0.243 |
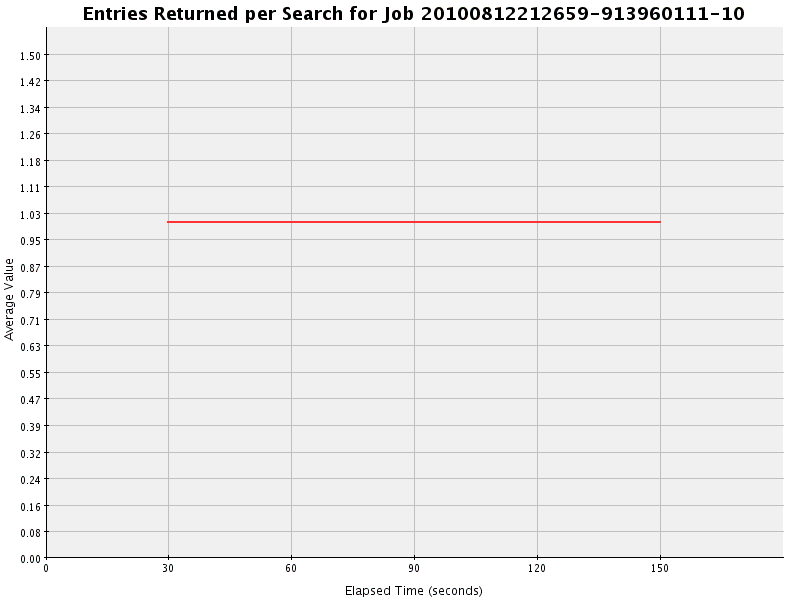
| Interval | Total | Count | Average | Avg/Second |
| 1 | 1534638 | 1534638 | 1.000 | 51154.600 |
| 2 | 1630557 | 1630557 | 1.000 | 54351.900 |
| 3 | 1592206 | 1592206 | 1.000 | 53073.533 |
| 4 | 1619182 | 1619182 | 1.000 | 53972.733 |
| 5 | 1591847 | 1591847 | 1.000 | 53061.567 |
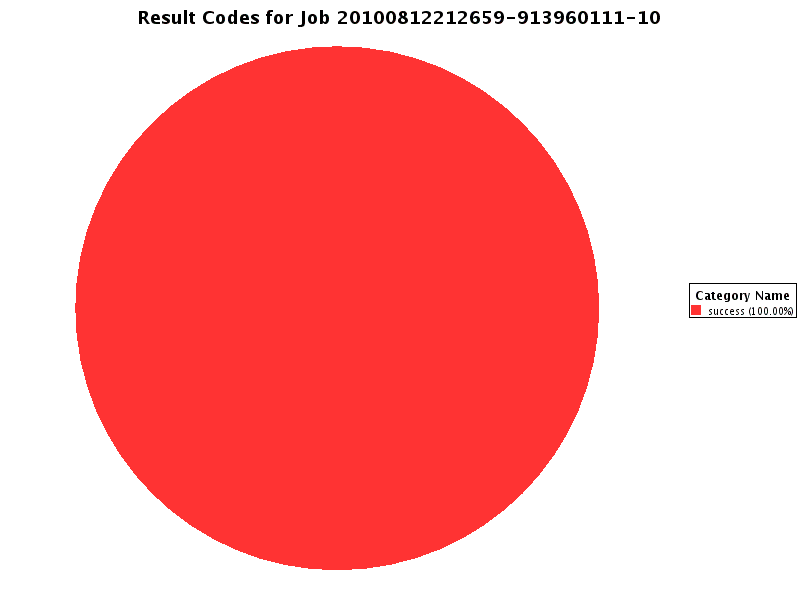
| Interval | success |
| Total | 9496087 (100.000%) |
| 0 | 1534655 (100.000) |
| 1 | 1630554 (100.000) |
| 2 | 1592203 (100.000) |
| 3 | 1619181 (100.000) |
| 4 | 1591855 (100.000) |
| 5 | 1527639 (100.000) |