| |
SLAMD Generated Report | Version 2.0.1 |
| Job ID | 20100811164122-573213106-19 | |
| Optimizing Job ID | 20100811164122-573213106 | |
| Job Description | two listeners 2.6.35 BDB4.8 (19 Threads) | |
| Job Type | LDAP SearchRate | |
| Job Class | com.slamd.jobs.LDAPSearchRateJobClass | |
| Job State | Stopped because the maximum duration had been reached |
| Scheduled Start Time | 08/11/2010 17:40:07 | |
| Scheduled Stop Time | (Not Specified) | |
| Scheduled Duration | 180 seconds | |
| Number of Clients | 8 | |
| Threads Per Client | 19 | |
| Thread Startup Delay | 0 milliseconds | |
| Statistics Collection Interval | 30 seconds |
| Server Addresses | ada:9011 | |
| Security Method | None | |
| Bind DN | dc=example,dc=com | |
| Bind Password | *** NOT DISPLAYED *** | |
| Search Base | dc=example,dc=com | |
| Search Scope | Whole Subtree | |
| Attributes to Return | cn description |
|
| Search Filter 1 | cn=user.[1-5000000] | |
| Search Filter 2 | objectclass=* | |
| Filter 1 Percentage | 100 | |
| Warm Up Time | 0 | |
| Cool Down Time | 0 | |
| Response Time Threshold (ms) | -1 | |
| Max Search Rate (Searches/Second/Client) | -1 | |
| Max Rate Enforcement Interval (Seconds) | 0 | |
| Size Limit | 0 | |
| Time Limit | 0 | |
| Time Between Requests (ms) | 0 |
| Actual Start Time | 08/11/2010 17:40:07 | |
| Actual Stop Time | 08/11/2010 17:43:08 | |
| Actual Duration | 180 seconds | |
| Clients Used |
sihu.symas.net:49305 dutar:40164 sihu.symas.net:49306 dutar:40169 sihu.symas.net:49307 dutar:40167 sihu.symas.net:49308 dutar:40170 |
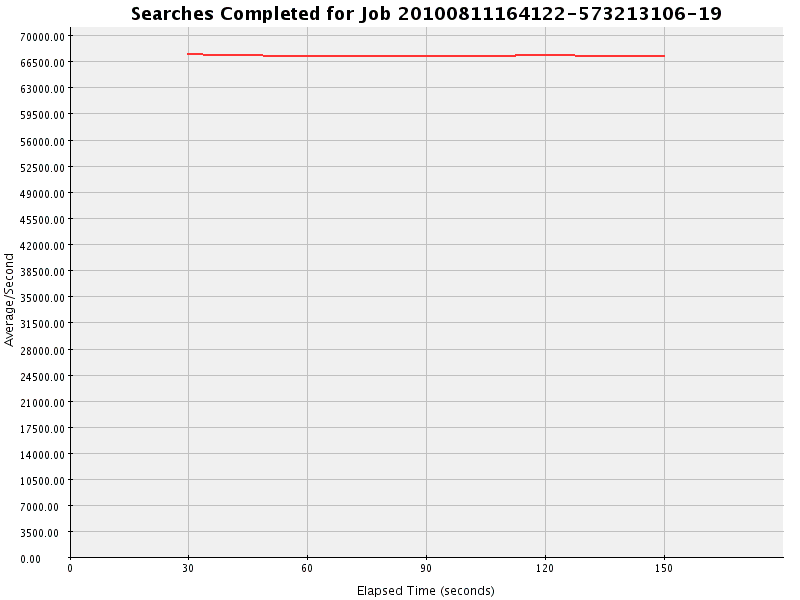
| Count | Avg/Second | Avg/Interval | Max/Interval | Min/Interval | Std Dev | Correlation Coefficient | Regression Equation | Horizontality T Score |
| 10093406 | 67289.373 | 2018681.200 | 2024068 | 2016018 | 105.707 | -0.334 | y = 67362.380 - 1.217x | 0.823 |
| Interval | Occurrences | Avg/Second |
| 1 | 2024068 | 67468.933 |
| 2 | 2016912 | 67230.400 |
| 3 | 2016018 | 67200.600 |
| 4 | 2018719 | 67290.633 |
| 5 | 2017689 | 67256.300 |
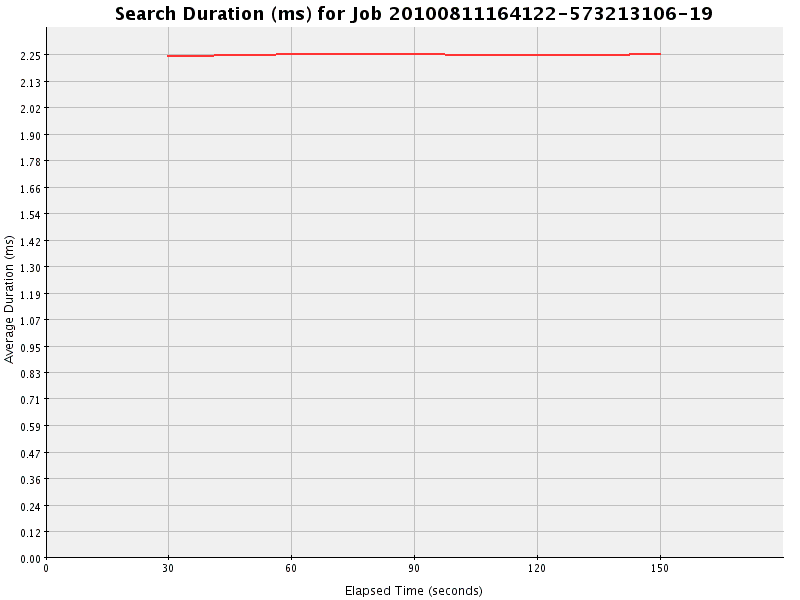
| Total Duration | Total Count | Avg Duration | Max Duration | Min Duration | Avg Count/Interval | Avg Duration/Interval | Std Dev | Correlation Coefficient | Regression Equation | Horizontality T Score |
| 22714853 | 10093444 | 2.250 | 39 | 0 | 2018688.800 | 4542970.600 | 0.004 | 0.333 | y = 2.248 + 0.000x | 0.242 |
| Interval | Total Duration | Count | Average Duration | Occurrences/Second |
| 1 | 4542744 | 2024113 | 2.244 | 67470.433 |
| 2 | 4542951 | 2016905 | 2.252 | 67230.167 |
| 3 | 4543127 | 2016028 | 2.254 | 67200.933 |
| 4 | 4542989 | 2018711 | 2.250 | 67290.367 |
| 5 | 4543042 | 2017687 | 2.252 | 67256.233 |
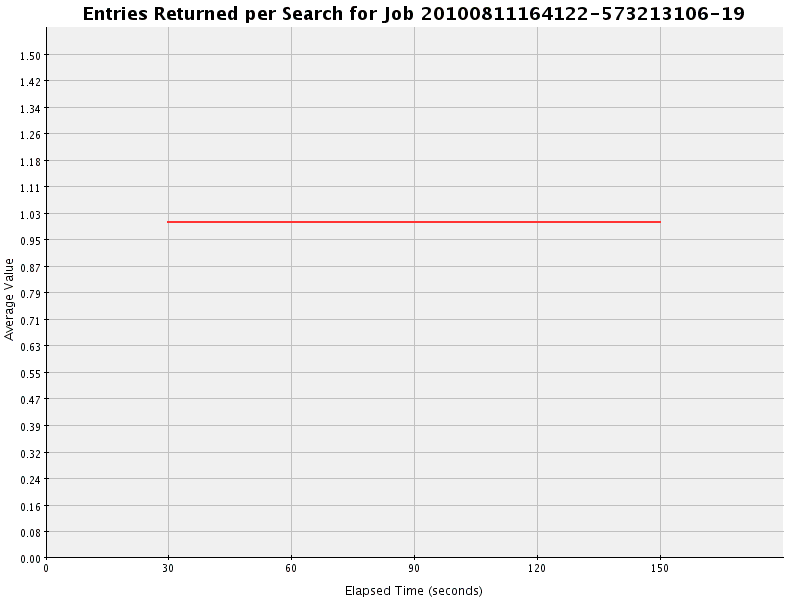
| Total | Avg Value | Max Value | Min Value | Avg/Second | Avg/Interval | Std Dev | Correlation Coefficient | Regression Equation | Horizontality T Score |
| 10093415 | 1.000 | 1 | 1 | 67289.433 | 2018683.000 | 0.000 | 0.000 | y = 1.000 + 0.000x | 0.243 |
| Interval | Total | Count | Average | Avg/Second |
| 1 | 2024078 | 2024078 | 1.000 | 67469.267 |
| 2 | 2016908 | 2016908 | 1.000 | 67230.267 |
| 3 | 2016021 | 2016021 | 1.000 | 67200.700 |
| 4 | 2018718 | 2018718 | 1.000 | 67290.600 |
| 5 | 2017690 | 2017690 | 1.000 | 67256.333 |
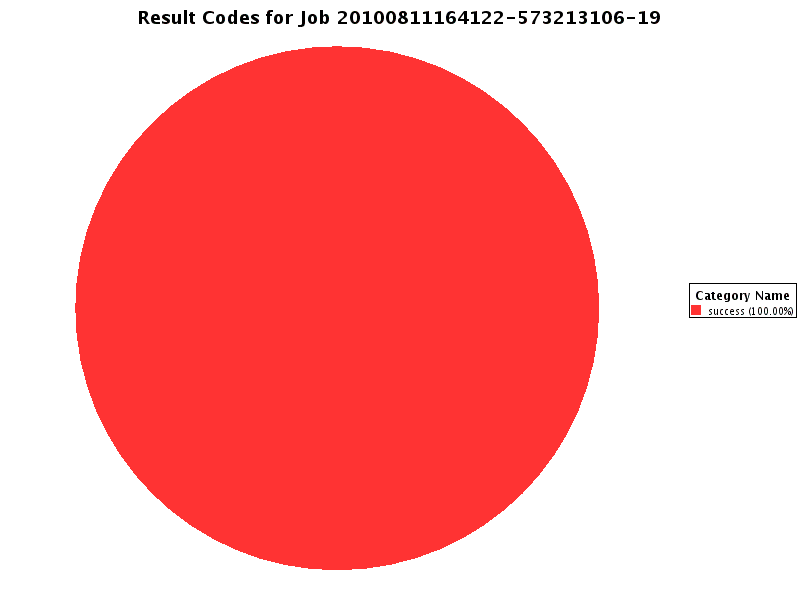
| Interval | success |
| Total | 12078556 (100.000%) |
| 0 | 2024080 (100.000) |
| 1 | 2016908 (100.000) |
| 2 | 2016022 (100.000) |
| 3 | 2018716 (100.000) |
| 4 | 2017691 (100.000) |
| 5 | 1985139 (100.000) |