| |
SLAMD Generated Report | Version 2.0.1 |
| Job ID | 20100811164122-573213106-16 | |
| Optimizing Job ID | 20100811164122-573213106 | |
| Job Description | two listeners 2.6.35 BDB4.8 (16 Threads) | |
| Job Type | LDAP SearchRate | |
| Job Class | com.slamd.jobs.LDAPSearchRateJobClass | |
| Job State | Stopped because the maximum duration had been reached |
| Scheduled Start Time | 08/11/2010 17:30:18 | |
| Scheduled Stop Time | (Not Specified) | |
| Scheduled Duration | 180 seconds | |
| Number of Clients | 8 | |
| Threads Per Client | 16 | |
| Thread Startup Delay | 0 milliseconds | |
| Statistics Collection Interval | 30 seconds |
| Server Addresses | ada:9011 | |
| Security Method | None | |
| Bind DN | dc=example,dc=com | |
| Bind Password | *** NOT DISPLAYED *** | |
| Search Base | dc=example,dc=com | |
| Search Scope | Whole Subtree | |
| Attributes to Return | cn description |
|
| Search Filter 1 | cn=user.[1-5000000] | |
| Search Filter 2 | objectclass=* | |
| Filter 1 Percentage | 100 | |
| Warm Up Time | 0 | |
| Cool Down Time | 0 | |
| Response Time Threshold (ms) | -1 | |
| Max Search Rate (Searches/Second/Client) | -1 | |
| Max Rate Enforcement Interval (Seconds) | 0 | |
| Size Limit | 0 | |
| Time Limit | 0 | |
| Time Between Requests (ms) | 0 |
| Actual Start Time | 08/11/2010 17:30:18 | |
| Actual Stop Time | 08/11/2010 17:33:20 | |
| Actual Duration | 180 seconds | |
| Clients Used |
sihu.symas.net:49305 dutar:40164 sihu.symas.net:49306 dutar:40169 sihu.symas.net:49307 dutar:40167 sihu.symas.net:49308 dutar:40170 |
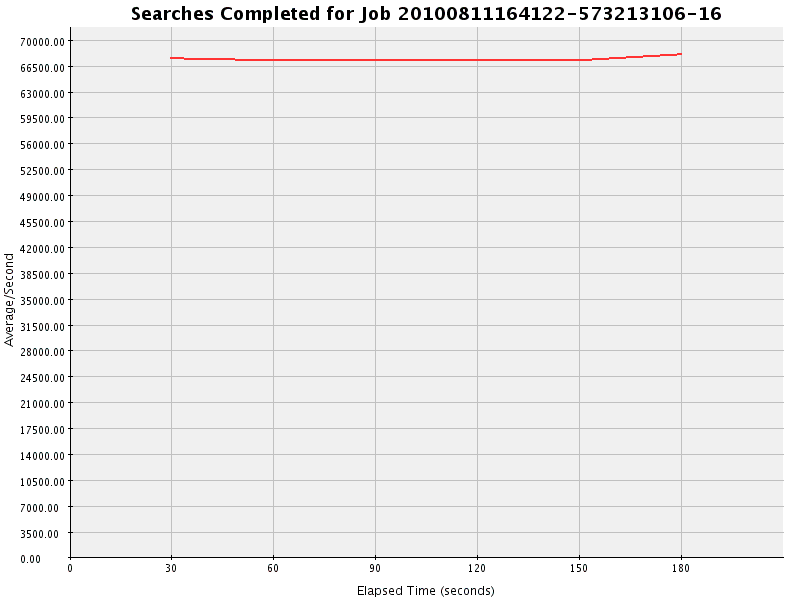
| Count | Avg/Second | Avg/Interval | Max/Interval | Min/Interval | Std Dev | Correlation Coefficient | Regression Equation | Horizontality T Score |
| 12142099 | 67456.106 | 2023683.167 | 2042365 | 2016560 | 324.225 | -0.279 | y = 67242.113 + 2.853x | 0.786 |
| Interval | Occurrences | Avg/Second |
| 1 | 2026231 | 67541.033 |
| 2 | 2016560 | 67218.667 |
| 3 | 2018511 | 67283.700 |
| 4 | 2018949 | 67298.300 |
| 5 | 2019483 | 67316.100 |
| 6 | 2042365 | 68078.833 |
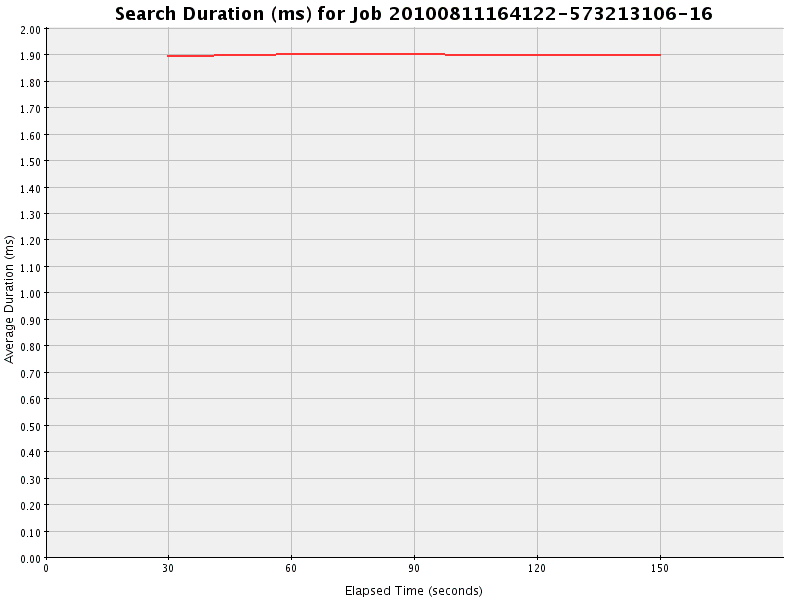
| Total Duration | Total Count | Avg Duration | Max Duration | Min Duration | Avg Count/Interval | Avg Duration/Interval | Std Dev | Correlation Coefficient | Regression Equation | Horizontality T Score |
| 19115019 | 10099761 | 1.893 | 137 | 0 | 2019952.200 | 3823003.800 | 0.004 | 0.333 | y = 1.890 + 0.000x | 0.242 |
| Interval | Total Duration | Count | Average Duration | Occurrences/Second |
| 1 | 3822806 | 2026268 | 1.887 | 67542.267 |
| 2 | 3823064 | 2016555 | 1.896 | 67218.500 |
| 3 | 3823065 | 2018514 | 1.894 | 67283.800 |
| 4 | 3823048 | 2018950 | 1.894 | 67298.333 |
| 5 | 3823036 | 2019474 | 1.893 | 67315.800 |
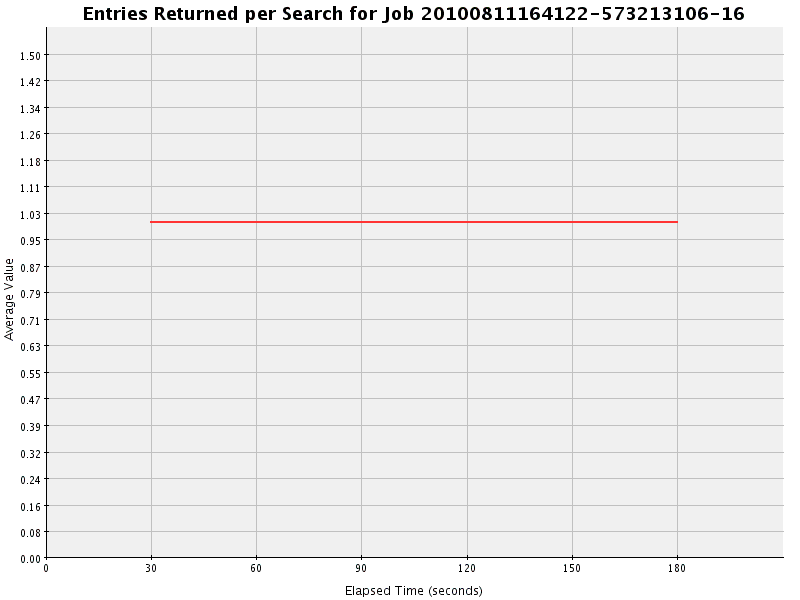
| Total | Avg Value | Max Value | Min Value | Avg/Second | Avg/Interval | Std Dev | Correlation Coefficient | Regression Equation | Horizontality T Score |
| 12142101 | 1.000 | 1 | 1 | 67456.117 | 2023683.500 | 0.000 | 0.000 | y = 1.000 + 0.000x | 0.000 |
| Interval | Total | Count | Average | Avg/Second |
| 1 | 2026232 | 2026232 | 1.000 | 67541.067 |
| 2 | 2016559 | 2016559 | 1.000 | 67218.633 |
| 3 | 2018511 | 2018511 | 1.000 | 67283.700 |
| 4 | 2018950 | 2018950 | 1.000 | 67298.333 |
| 5 | 2019484 | 2019484 | 1.000 | 67316.133 |
| 6 | 2042365 | 2042365 | 1.000 | 68078.833 |
| Interval | success |
| Total | 12142102 (100.000%) |
| 0 | 2026233 (100.000) |
| 1 | 2016559 (100.000) |
| 2 | 2018511 (100.000) |
| 3 | 2018949 (100.000) |
| 4 | 2019483 (100.000) |
| 5 | 2042367 (100.000) |