| |
SLAMD Generated Report | Version 2.0.1 |
| Job ID | 20100811164122-573213106-15 | |
| Optimizing Job ID | 20100811164122-573213106 | |
| Job Description | two listeners 2.6.35 BDB4.8 (15 Threads) | |
| Job Type | LDAP SearchRate | |
| Job Class | com.slamd.jobs.LDAPSearchRateJobClass | |
| Job State | Stopped because the maximum duration had been reached |
| Scheduled Start Time | 08/11/2010 17:27:03 | |
| Scheduled Stop Time | (Not Specified) | |
| Scheduled Duration | 180 seconds | |
| Number of Clients | 8 | |
| Threads Per Client | 15 | |
| Thread Startup Delay | 0 milliseconds | |
| Statistics Collection Interval | 30 seconds |
| Server Addresses | ada:9011 | |
| Security Method | None | |
| Bind DN | dc=example,dc=com | |
| Bind Password | *** NOT DISPLAYED *** | |
| Search Base | dc=example,dc=com | |
| Search Scope | Whole Subtree | |
| Attributes to Return | cn description |
|
| Search Filter 1 | cn=user.[1-5000000] | |
| Search Filter 2 | objectclass=* | |
| Filter 1 Percentage | 100 | |
| Warm Up Time | 0 | |
| Cool Down Time | 0 | |
| Response Time Threshold (ms) | -1 | |
| Max Search Rate (Searches/Second/Client) | -1 | |
| Max Rate Enforcement Interval (Seconds) | 0 | |
| Size Limit | 0 | |
| Time Limit | 0 | |
| Time Between Requests (ms) | 0 |
| Actual Start Time | 08/11/2010 17:27:03 | |
| Actual Stop Time | 08/11/2010 17:30:03 | |
| Actual Duration | 180 seconds | |
| Clients Used |
sihu.symas.net:49305 dutar:40164 sihu.symas.net:49306 dutar:40169 sihu.symas.net:49307 dutar:40167 sihu.symas.net:49308 dutar:40170 |
| Count | Avg/Second | Avg/Interval | Max/Interval | Min/Interval | Std Dev | Correlation Coefficient | Regression Equation | Horizontality T Score |
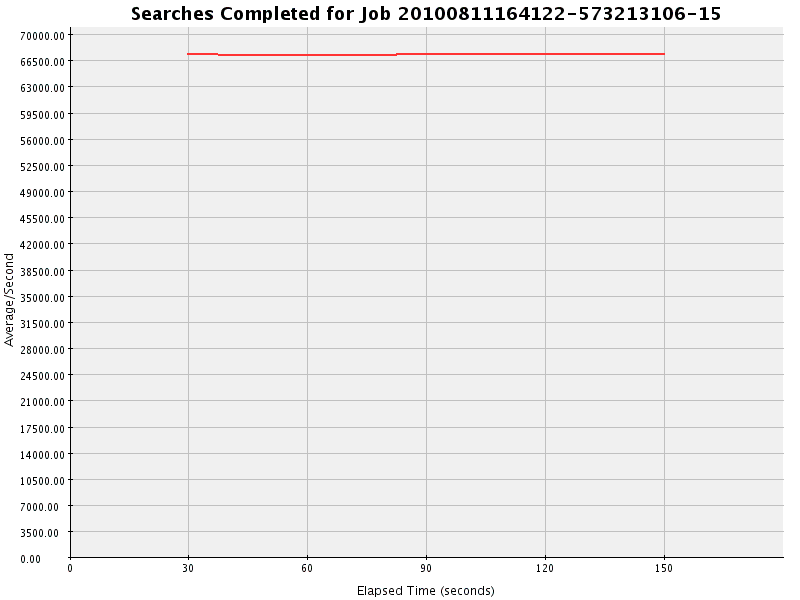
| 10095410 | 67302.733 | 2019082.000 | 2020008 | 2017632 | 29.225 | -0.333 | y = 67300.927 + 0.030x | 0.367 |
| Interval | Occurrences | Avg/Second |
| 1 | 2020008 | 67333.600 |
| 2 | 2017632 | 67254.400 |
| 3 | 2019137 | 67304.567 |
| 4 | 2019347 | 67311.567 |
| 5 | 2019286 | 67309.533 |
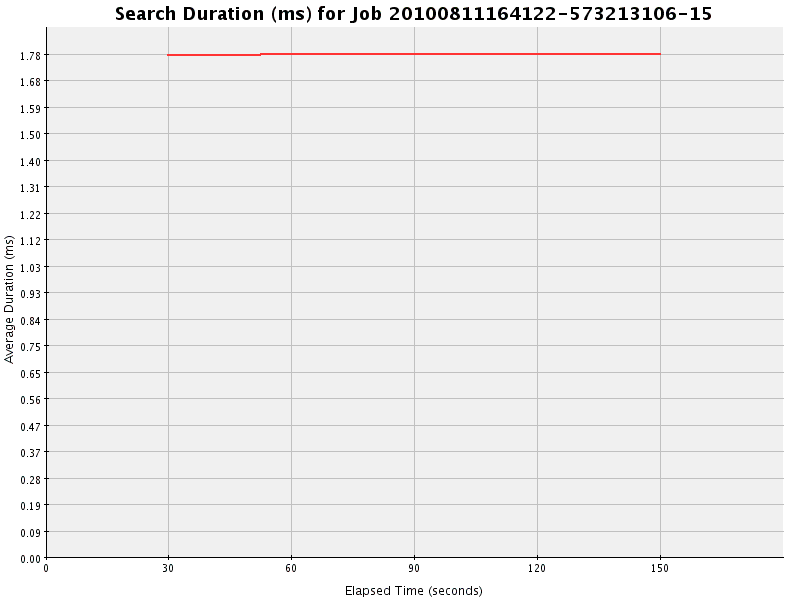
| Total Duration | Total Count | Avg Duration | Max Duration | Min Duration | Avg Count/Interval | Avg Duration/Interval | Std Dev | Correlation Coefficient | Regression Equation | Horizontality T Score |
| 17915632 | 10095444 | 1.775 | 28 | 0 | 2019088.800 | 3583126.400 | 0.001 | 0.333 | y = 1.775 - 0.000x | 0.243 |
| Interval | Total Duration | Count | Average Duration | Occurrences/Second |
| 1 | 3583102 | 2020048 | 1.774 | 67334.933 |
| 2 | 3583204 | 2017620 | 1.776 | 67254.000 |
| 3 | 3583200 | 2019146 | 1.775 | 67304.867 |
| 4 | 3583062 | 2019337 | 1.774 | 67311.233 |
| 5 | 3583064 | 2019293 | 1.774 | 67309.767 |
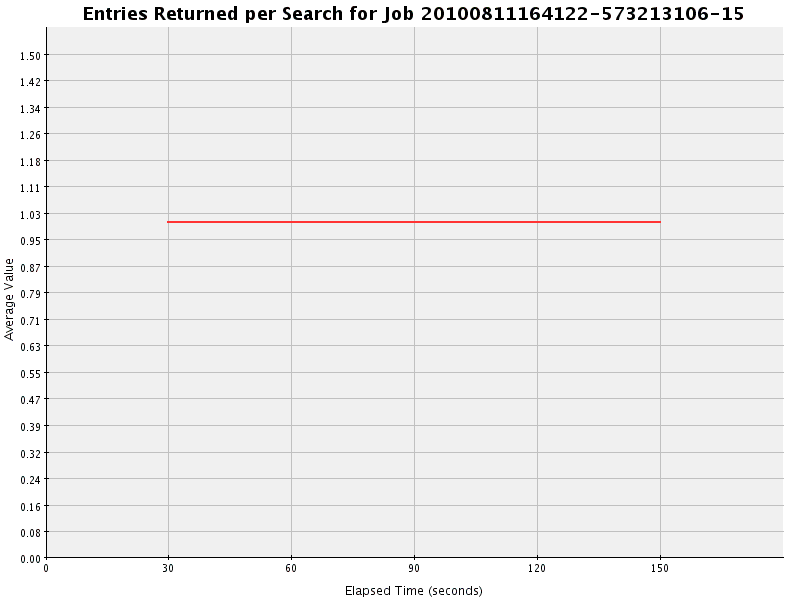
| Total | Avg Value | Max Value | Min Value | Avg/Second | Avg/Interval | Std Dev | Correlation Coefficient | Regression Equation | Horizontality T Score |
| 10095417 | 1.000 | 1 | 1 | 67302.780 | 2019083.400 | 0.000 | 0.000 | y = 1.000 + 0.000x | 0.243 |
| Interval | Total | Count | Average | Avg/Second |
| 1 | 2020015 | 2020015 | 1.000 | 67333.833 |
| 2 | 2017632 | 2017632 | 1.000 | 67254.400 |
| 3 | 2019140 | 2019140 | 1.000 | 67304.667 |
| 4 | 2019342 | 2019342 | 1.000 | 67311.400 |
| 5 | 2019288 | 2019288 | 1.000 | 67309.600 |
| Interval | success |
| Total | 12096973 (100.000%) |
| 0 | 2020018 (100.000) |
| 1 | 2017631 (100.000) |
| 2 | 2019139 (100.000) |
| 3 | 2019344 (100.000) |
| 4 | 2019287 (100.000) |
| 5 | 2001554 (100.000) |