| |
SLAMD Generated Report | Version 2.0.1 |
| Job ID | 20100713215406-07423928 | |
| Job Description | 11M prime, per-CPU threads | |
| Job Type | LDAP SearchRate | |
| Job Class | com.slamd.jobs.LDAPSearchRateJobClass | |
| Job State | Stopped because the maximum duration had been reached |
| Scheduled Start Time | 07/13/2010 21:53:53 | |
| Scheduled Stop Time | (Not Specified) | |
| Scheduled Duration | 600 seconds | |
| Number of Clients | 24 | |
| Threads Per Client | 1 | |
| Thread Startup Delay | 0 milliseconds | |
| Statistics Collection Interval | 30 seconds |
| Server Addresses | node-0004 | |
| Security Method | None | |
| Bind DN | ||
| Bind Password | *** NOT DISPLAYED *** | |
| Search Base | o=example,c=us | |
| Search Scope | Whole Subtree | |
| Attributes to Return | sampleAttr | |
| Search Filter 1 | uid=[1000000000-1010999999] | |
| Search Filter 2 | objectclass=* | |
| Filter 1 Percentage | 100 | |
| Warm Up Time | 0 | |
| Cool Down Time | 0 | |
| Response Time Threshold (ms) | -1 | |
| Max Search Rate (Searches/Second/Client) | -1 | |
| Max Rate Enforcement Interval (Seconds) | 0 | |
| Size Limit | 0 | |
| Time Limit | 0 | |
| Time Between Requests (ms) | 0 |
| Actual Start Time | 07/13/2010 21:54:06 | |
| Actual Stop Time | 07/13/2010 22:04:06 | |
| Actual Duration | 600 seconds | |
| Clients Used |
node-0003.node.local:34500 node-0003.node.local:34503 node-0003.node.local:34504 node-0003.node.local:34499 node-0003.node.local:34510 node-0003.node.local:34497 node-0003.node.local:34511 node-0003.node.local:34509 node-0003.node.local:34519 node-0003.node.local:34513 node-0003.node.local:34508 node-0003.node.local:34505 node-0003.node.local:34516 node-0003.node.local:34520 node-0003.node.local:34518 node-0003.node.local:34514 node-0003.node.local:34498 node-0003.node.local:34515 node-0003.node.local:34517 node-0003.node.local:34512 node-0003.node.local:34502 node-0003.node.local:34507 node-0003.node.local:34506 node-0003.node.local:34501 |
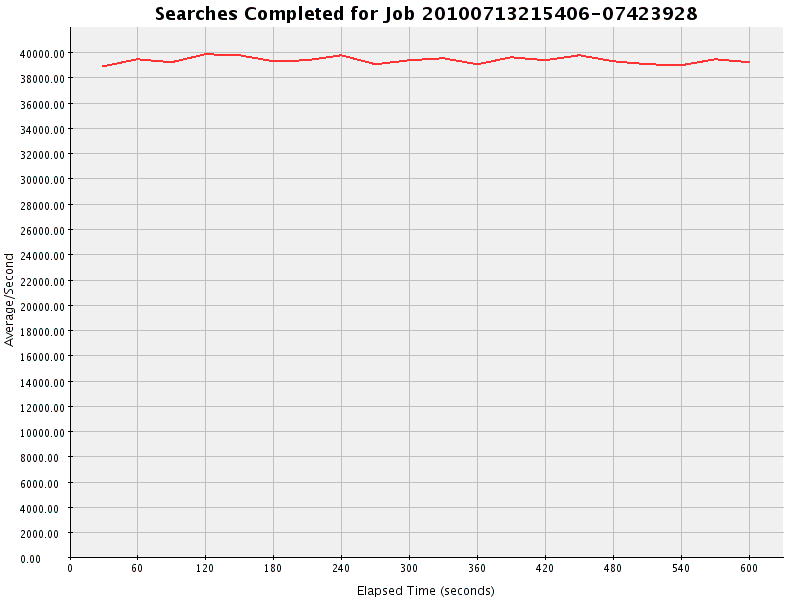
| Count | Avg/Second | Avg/Interval | Max/Interval | Min/Interval | Std Dev | Correlation Coefficient | Regression Equation | Horizontality T Score |
| 23614450 | 39357.417 | 1180722.500 | 1195378 | 1167694 | 282.881 | -0.088 | y = 39434.302 - 0.270x | 0.629 |
| Interval | Occurrences | Avg/Second |
| 1 | 1167694 | 38923.133 |
| 2 | 1183374 | 39445.800 |
| 3 | 1176681 | 39222.700 |
| 4 | 1195378 | 39845.933 |
| 5 | 1192439 | 39747.967 |
| 6 | 1178224 | 39274.133 |
| 7 | 1180539 | 39351.300 |
| 8 | 1192600 | 39753.333 |
| 9 | 1171395 | 39046.500 |
| 10 | 1181032 | 39367.733 |
| 11 | 1185117 | 39503.900 |
| 12 | 1171043 | 39034.767 |
| 13 | 1187695 | 39589.833 |
| 14 | 1181295 | 39376.500 |
| 15 | 1192915 | 39763.833 |
| 16 | 1178100 | 39270.000 |
| 17 | 1171097 | 39036.567 |
| 18 | 1168487 | 38949.567 |
| 19 | 1183327 | 39444.233 |
| 20 | 1176018 | 39200.600 |
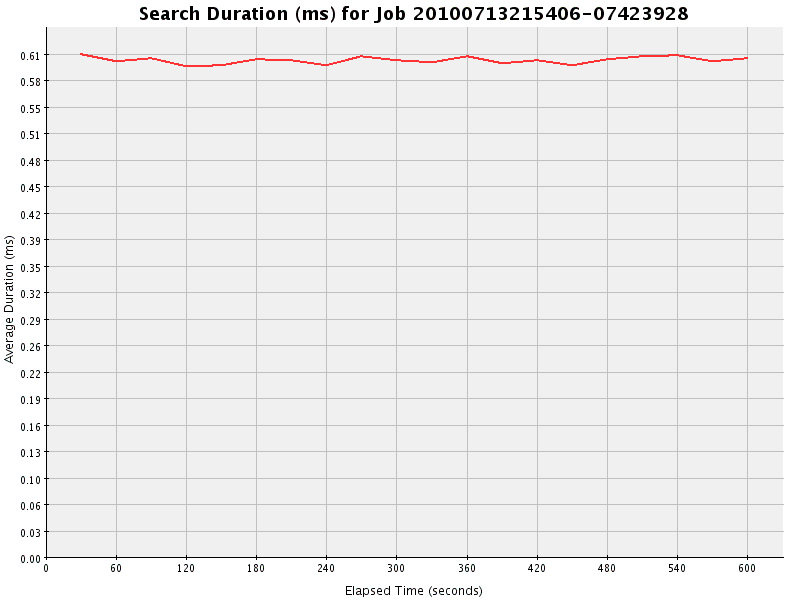
| Total Duration | Total Count | Avg Duration | Max Duration | Min Duration | Avg Count/Interval | Avg Duration/Interval | Std Dev | Correlation Coefficient | Regression Equation | Horizontality T Score |
| 14234930 | 23614486 | 0.603 | 38 | 0 | 1180724.300 | 711746.500 | 0.004 | 0.086 | y = 0.602 + 0.000x | 0.000 |
| Interval | Total Duration | Count | Average Duration | Occurrences/Second |
| 1 | 712087 | 1167713 | 0.610 | 38923.767 |
| 2 | 711730 | 1183373 | 0.601 | 39445.767 |
| 3 | 711727 | 1176690 | 0.605 | 39223.000 |
| 4 | 711864 | 1195376 | 0.596 | 39845.867 |
| 5 | 711904 | 1192435 | 0.597 | 39747.833 |
| 6 | 711832 | 1178226 | 0.604 | 39274.200 |
| 7 | 711637 | 1180540 | 0.603 | 39351.333 |
| 8 | 711758 | 1192601 | 0.597 | 39753.367 |
| 9 | 711711 | 1171390 | 0.608 | 39046.333 |
| 10 | 711670 | 1181036 | 0.603 | 39367.867 |
| 11 | 711666 | 1185114 | 0.601 | 39503.800 |
| 12 | 711676 | 1171045 | 0.608 | 39034.833 |
| 13 | 711742 | 1187692 | 0.599 | 39589.733 |
| 14 | 711638 | 1181297 | 0.602 | 39376.567 |
| 15 | 711704 | 1192915 | 0.597 | 39763.833 |
| 16 | 711929 | 1178098 | 0.604 | 39269.933 |
| 17 | 711593 | 1171096 | 0.608 | 39036.533 |
| 18 | 711719 | 1168495 | 0.609 | 38949.833 |
| 19 | 711746 | 1183323 | 0.601 | 39444.100 |
| 20 | 711597 | 1176031 | 0.605 | 39201.033 |
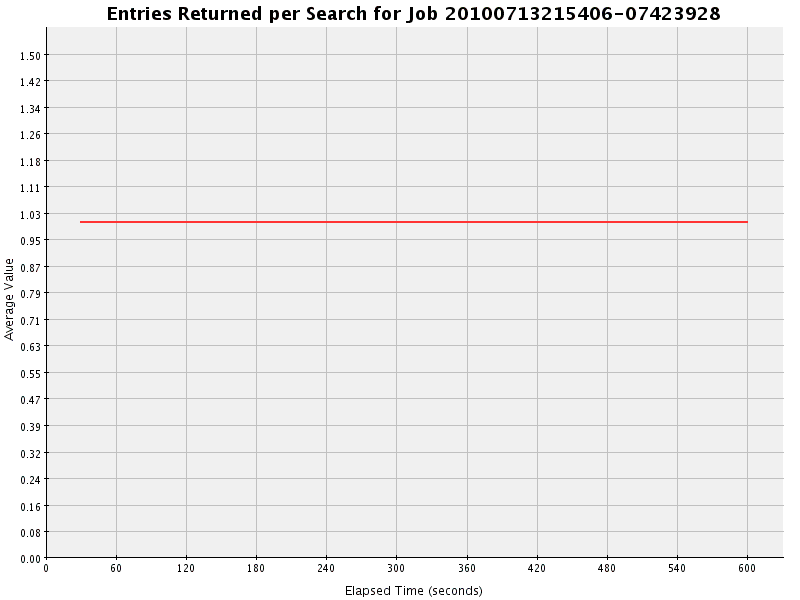
| Total | Avg Value | Max Value | Min Value | Avg/Second | Avg/Interval | Std Dev | Correlation Coefficient | Regression Equation | Horizontality T Score |
| 23614450 | 1.000 | 1 | 1 | 39357.417 | 1180722.500 | 0.000 | 0.000 | y = 1.000 + 0.000x | 0.000 |
| Interval | Total | Count | Average | Avg/Second |
| 1 | 1167694 | 1167694 | 1.000 | 38923.133 |
| 2 | 1183374 | 1183374 | 1.000 | 39445.800 |
| 3 | 1176681 | 1176681 | 1.000 | 39222.700 |
| 4 | 1195378 | 1195378 | 1.000 | 39845.933 |
| 5 | 1192439 | 1192439 | 1.000 | 39747.967 |
| 6 | 1178224 | 1178224 | 1.000 | 39274.133 |
| 7 | 1180539 | 1180539 | 1.000 | 39351.300 |
| 8 | 1192600 | 1192600 | 1.000 | 39753.333 |
| 9 | 1171395 | 1171395 | 1.000 | 39046.500 |
| 10 | 1181032 | 1181032 | 1.000 | 39367.733 |
| 11 | 1185117 | 1185117 | 1.000 | 39503.900 |
| 12 | 1171043 | 1171043 | 1.000 | 39034.767 |
| 13 | 1187695 | 1187695 | 1.000 | 39589.833 |
| 14 | 1181295 | 1181295 | 1.000 | 39376.500 |
| 15 | 1192915 | 1192915 | 1.000 | 39763.833 |
| 16 | 1178100 | 1178100 | 1.000 | 39270.000 |
| 17 | 1171097 | 1171097 | 1.000 | 39036.567 |
| 18 | 1168487 | 1168487 | 1.000 | 38949.567 |
| 19 | 1183327 | 1183327 | 1.000 | 39444.233 |
| 20 | 1176018 | 1176018 | 1.000 | 39200.600 |
| Interval | success |
| Total | 23614453 (100.000%) |
| 0 | 1167695 (100.000) |
| 1 | 1183374 (100.000) |
| 2 | 1176681 (100.000) |
| 3 | 1195377 (100.000) |
| 4 | 1192439 (100.000) |
| 5 | 1178225 (100.000) |
| 6 | 1180539 (100.000) |
| 7 | 1192600 (100.000) |
| 8 | 1171396 (100.000) |
| 9 | 1181031 (100.000) |
| 10 | 1185117 (100.000) |
| 11 | 1171043 (100.000) |
| 12 | 1187695 (100.000) |
| 13 | 1181296 (100.000) |
| 14 | 1192914 (100.000) |
| 15 | 1178100 (100.000) |
| 16 | 1171097 (100.000) |
| 17 | 1168489 (100.000) |
| 18 | 1183324 (100.000) |
| 19 | 1176021 (100.000) |