| |
SLAMD Generated Report | Version 2.0.1 |
| Job ID | 20100713212658-28344827 | |
| Job Description | 11M prime | |
| Job Type | LDAP SearchRate | |
| Job Class | com.slamd.jobs.LDAPSearchRateJobClass | |
| Job State | Stopped because the maximum duration had been reached |
| Scheduled Start Time | 07/13/2010 21:26:38 | |
| Scheduled Stop Time | (Not Specified) | |
| Scheduled Duration | 600 seconds | |
| Number of Clients | 24 | |
| Threads Per Client | 1 | |
| Thread Startup Delay | 0 milliseconds | |
| Statistics Collection Interval | 30 seconds |
| Server Addresses | node-0004 | |
| Security Method | None | |
| Bind DN | ||
| Bind Password | *** NOT DISPLAYED *** | |
| Search Base | o=example,c=us | |
| Search Scope | Whole Subtree | |
| Attributes to Return | sampleAttr | |
| Search Filter 1 | uid=[1000000000-1010999999] | |
| Search Filter 2 | objectclass=* | |
| Filter 1 Percentage | 100 | |
| Warm Up Time | 0 | |
| Cool Down Time | 0 | |
| Response Time Threshold (ms) | -1 | |
| Max Search Rate (Searches/Second/Client) | -1 | |
| Max Rate Enforcement Interval (Seconds) | 0 | |
| Size Limit | 0 | |
| Time Limit | 0 | |
| Time Between Requests (ms) | 0 |
| Actual Start Time | 07/13/2010 21:27:26 | |
| Actual Stop Time | 07/13/2010 21:37:27 | |
| Actual Duration | 600 seconds | |
| Clients Used |
node-0003.node.local:34500 node-0003.node.local:34503 node-0003.node.local:34504 node-0003.node.local:34499 node-0003.node.local:34510 node-0003.node.local:34497 node-0003.node.local:34511 node-0003.node.local:34509 node-0003.node.local:34519 node-0003.node.local:34513 node-0003.node.local:34508 node-0003.node.local:34505 node-0003.node.local:34516 node-0003.node.local:34520 node-0003.node.local:34518 node-0003.node.local:34514 node-0003.node.local:34498 node-0003.node.local:34515 node-0003.node.local:34517 node-0003.node.local:34512 node-0003.node.local:34502 node-0003.node.local:34507 node-0003.node.local:34506 node-0003.node.local:34501 |
| Count | Avg/Second | Avg/Interval | Max/Interval | Min/Interval | Std Dev | Correlation Coefficient | Regression Equation | Horizontality T Score |
| 15274859 | 25458.098 | 763742.950 | 806242 | 658022 | 1625.879 | -0.033 | y = 23274.833 + 7.661x | 3.966 |
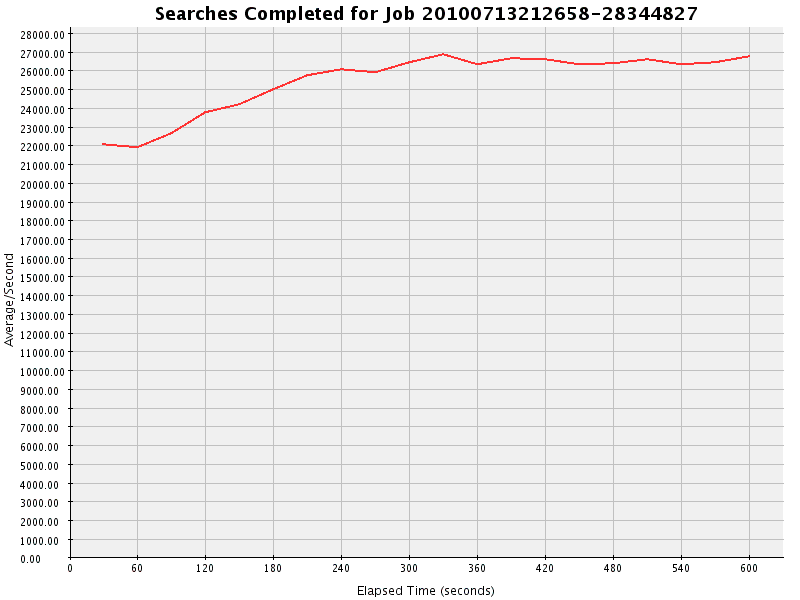
| Interval | Occurrences | Avg/Second |
| 1 | 661563 | 22052.100 |
| 2 | 658022 | 21934.067 |
| 3 | 678987 | 22632.900 |
| 4 | 712779 | 23759.300 |
| 5 | 726932 | 24231.067 |
| 6 | 750132 | 25004.400 |
| 7 | 772757 | 25758.567 |
| 8 | 781753 | 26058.433 |
| 9 | 777098 | 25903.267 |
| 10 | 792771 | 26425.700 |
| 11 | 806242 | 26874.733 |
| 12 | 790639 | 26354.633 |
| 13 | 799443 | 26648.100 |
| 14 | 798861 | 26628.700 |
| 15 | 790707 | 26356.900 |
| 16 | 791206 | 26373.533 |
| 17 | 797716 | 26590.533 |
| 18 | 790584 | 26352.800 |
| 19 | 793243 | 26441.433 |
| 20 | 803424 | 26780.800 |
| Total Duration | Total Count | Avg Duration | Max Duration | Min Duration | Avg Count/Interval | Avg Duration/Interval | Std Dev | Correlation Coefficient | Regression Equation | Horizontality T Score |
| 14270677 | 15274883 | 0.934 | 4304 | 0 | 763744.150 | 713533.850 | 0.066 | -0.255 | y = 1.025 - 0.000x | 0.020 |
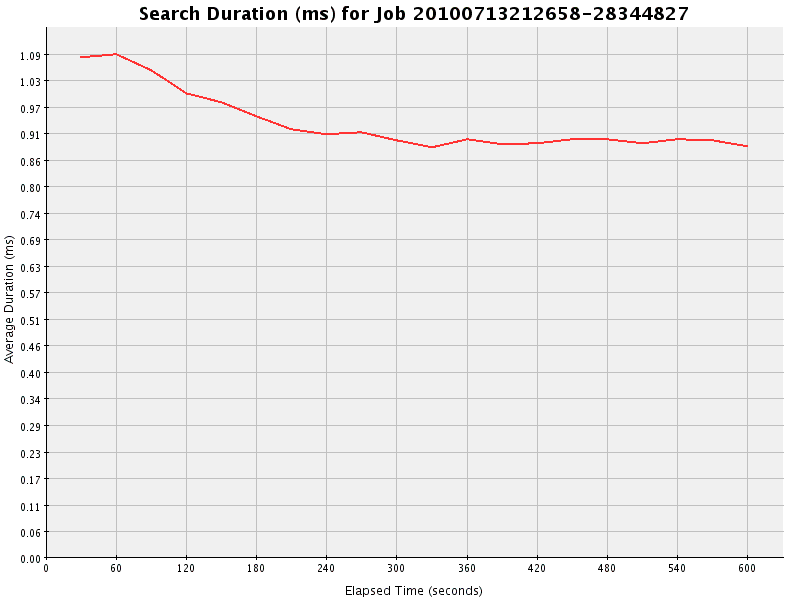
| Interval | Total Duration | Count | Average Duration | Occurrences/Second |
| 1 | 714218 | 661577 | 1.080 | 22052.567 |
| 2 | 714263 | 658023 | 1.085 | 21934.100 |
| 3 | 714164 | 678987 | 1.052 | 22632.900 |
| 4 | 713893 | 712774 | 1.002 | 23759.133 |
| 5 | 713621 | 726941 | 0.982 | 24231.367 |
| 6 | 713350 | 750131 | 0.951 | 25004.367 |
| 7 | 713478 | 772757 | 0.923 | 25758.567 |
| 8 | 713481 | 781749 | 0.913 | 26058.300 |
| 9 | 713486 | 777101 | 0.918 | 25903.367 |
| 10 | 713390 | 792766 | 0.900 | 26425.533 |
| 11 | 713294 | 806245 | 0.885 | 26874.833 |
| 12 | 713376 | 790642 | 0.902 | 26354.733 |
| 13 | 713335 | 799441 | 0.892 | 26648.033 |
| 14 | 713313 | 798858 | 0.893 | 26628.600 |
| 15 | 713355 | 790709 | 0.902 | 26356.967 |
| 16 | 713344 | 791202 | 0.902 | 26373.400 |
| 17 | 713323 | 797720 | 0.894 | 26590.667 |
| 18 | 713357 | 790588 | 0.902 | 26352.933 |
| 19 | 713347 | 793241 | 0.899 | 26441.367 |
| 20 | 713289 | 803431 | 0.888 | 26781.033 |
| Total | Avg Value | Max Value | Min Value | Avg/Second | Avg/Interval | Std Dev | Correlation Coefficient | Regression Equation | Horizontality T Score |
| 15274862 | 1.000 | 1 | 1 | 25458.103 | 763743.100 | 0.000 | 0.000 | y = 1.000 + 0.000x | 0.000 |
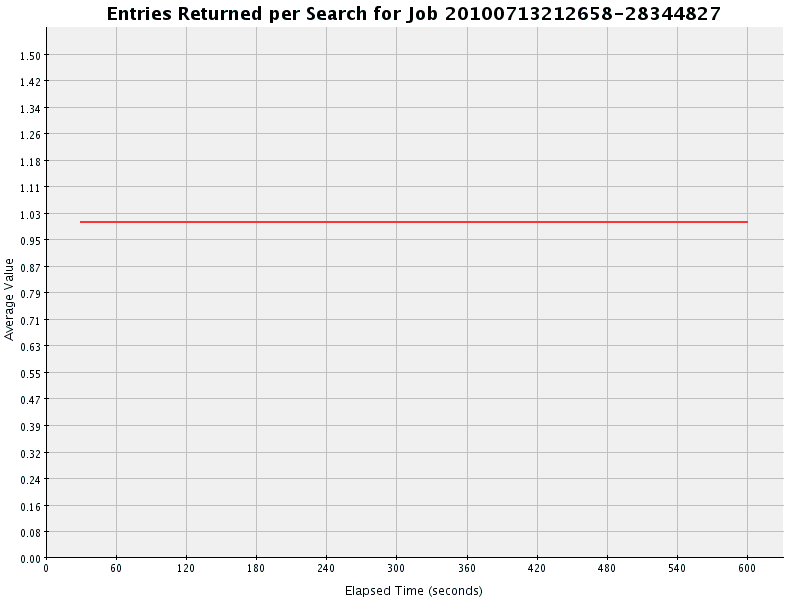
| Interval | Total | Count | Average | Avg/Second |
| 1 | 661566 | 661566 | 1.000 | 22052.200 |
| 2 | 658020 | 658020 | 1.000 | 21934.000 |
| 3 | 678988 | 678988 | 1.000 | 22632.933 |
| 4 | 712778 | 712778 | 1.000 | 23759.267 |
| 5 | 726932 | 726932 | 1.000 | 24231.067 |
| 6 | 750133 | 750133 | 1.000 | 25004.433 |
| 7 | 772757 | 772757 | 1.000 | 25758.567 |
| 8 | 781753 | 781753 | 1.000 | 26058.433 |
| 9 | 777098 | 777098 | 1.000 | 25903.267 |
| 10 | 792770 | 792770 | 1.000 | 26425.667 |
| 11 | 806243 | 806243 | 1.000 | 26874.767 |
| 12 | 790641 | 790641 | 1.000 | 26354.700 |
| 13 | 799442 | 799442 | 1.000 | 26648.067 |
| 14 | 798859 | 798859 | 1.000 | 26628.633 |
| 15 | 790707 | 790707 | 1.000 | 26356.900 |
| 16 | 791207 | 791207 | 1.000 | 26373.567 |
| 17 | 797716 | 797716 | 1.000 | 26590.533 |
| 18 | 790585 | 790585 | 1.000 | 26352.833 |
| 19 | 793242 | 793242 | 1.000 | 26441.400 |
| 20 | 803425 | 803425 | 1.000 | 26780.833 |
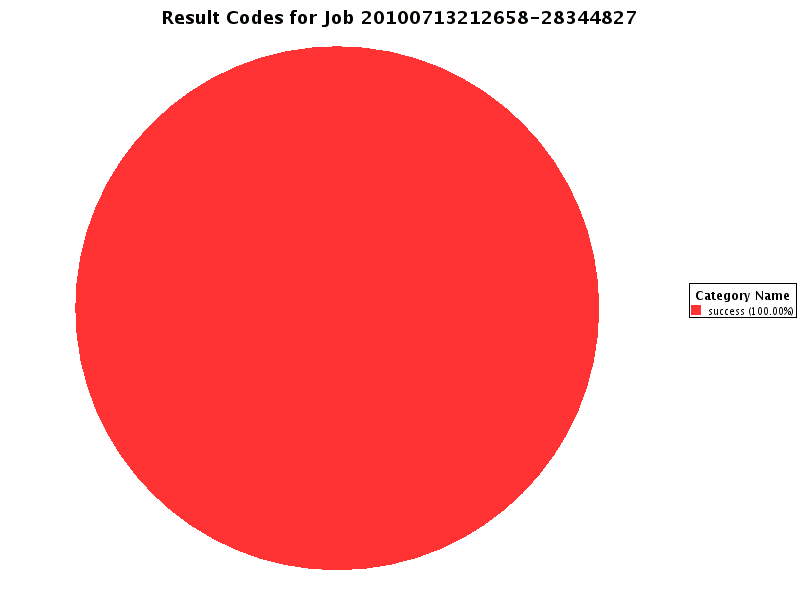
| Interval | success |
| Total | 15274862 (100.000%) |
| 0 | 661566 (100.000) |
| 1 | 658020 (100.000) |
| 2 | 678988 (100.000) |
| 3 | 712778 (100.000) |
| 4 | 726932 (100.000) |
| 5 | 750133 (100.000) |
| 6 | 772757 (100.000) |
| 7 | 781753 (100.000) |
| 8 | 777098 (100.000) |
| 9 | 792770 (100.000) |
| 10 | 806243 (100.000) |
| 11 | 790641 (100.000) |
| 12 | 799442 (100.000) |
| 13 | 798859 (100.000) |
| 14 | 790707 (100.000) |
| 15 | 791207 (100.000) |
| 16 | 797716 (100.000) |
| 17 | 790585 (100.000) |
| 18 | 793242 (100.000) |
| 19 | 803425 (100.000) |