| |
SLAMD Generated Report | Version 2.0.1 |
| Job ID | 20110915155839-403075146 | |
| Job Description | mdb 16 server threads 2 listeners | |
| Job Type | LDAP SearchRate | |
| Job Class | com.slamd.jobs.LDAPSearchRateJobClass | |
| Job State | Stopped because the maximum duration had been reached |
| Scheduled Start Time | 09/15/2011 15:58:19 | |
| Scheduled Stop Time | (Not Specified) | |
| Scheduled Duration | 300 seconds | |
| Number of Clients | 28 | |
| Threads Per Client | 8 | |
| Thread Startup Delay | 0 milliseconds | |
| Statistics Collection Interval | 30 seconds |
| Server Addresses | ada:9001 | |
| Security Method | None | |
| Bind DN | dc=example,dc=com | |
| Bind Password | *** NOT DISPLAYED *** | |
| Search Base | dc=example,dc=com | |
| Search Scope | Whole Subtree | |
| Attributes to Return | cn description |
|
| Search Filter 1 | cn=user.[1-5000000] | |
| Search Filter 2 | objectclass=* | |
| Filter 1 Percentage | 100 | |
| Warm Up Time | 15 | |
| Cool Down Time | 0 | |
| Response Time Threshold (ms) | -1 | |
| Max Search Rate (Searches/Second/Client) | -1 | |
| Max Rate Enforcement Interval (Seconds) | 0 | |
| Size Limit | 0 | |
| Time Limit | 0 | |
| Time Between Requests (ms) | 0 |
| Actual Start Time | 09/15/2011 15:58:53 | |
| Actual Stop Time | 09/15/2011 16:05:44 | |
| Actual Duration | 300 seconds | |
| Clients Used |
lg1:35381 malunga:40260 dutar:51465 dutar:51467 zither.rb.symas.net:32945 lg1:53309 zither.rb.symas.net:34784 malunga:50241 lg1:49498 malunga:33752 dutar:56416 malunga:52632 dutar:36917 lg1:49502 malunga:41191 malunga:58808 dutar:36918 dutar:36922 dutar:36926 |
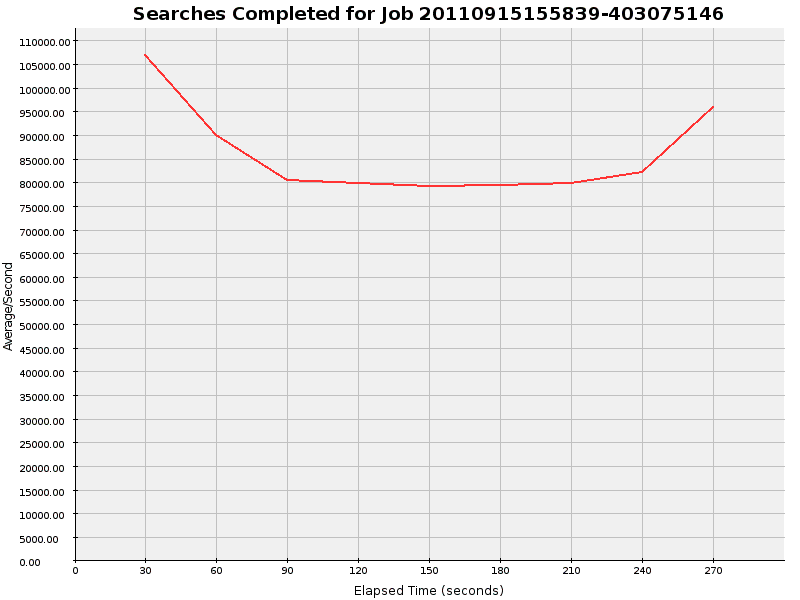
| Count | Avg/Second | Avg/Interval | Max/Interval | Min/Interval | Std Dev | Correlation Coefficient | Regression Equation | Horizontality T Score |
| 23198108 | 85918.919 | 2577567.556 | 3206534 | 2373443 | 9767.343 | -0.224 | y = 90562.019 - 38.692x | 0.853 |
| Interval | Occurrences | Avg/Second |
| 1 | 3206534 | 106884.467 |
| 2 | 2699015 | 89967.167 |
| 3 | 2413147 | 80438.233 |
| 4 | 2393896 | 79796.533 |
| 5 | 2373443 | 79114.767 |
| 6 | 2382301 | 79410.033 |
| 7 | 2392618 | 79753.933 |
| 8 | 2462177 | 82072.567 |
| 9 | 2874977 | 95832.567 |
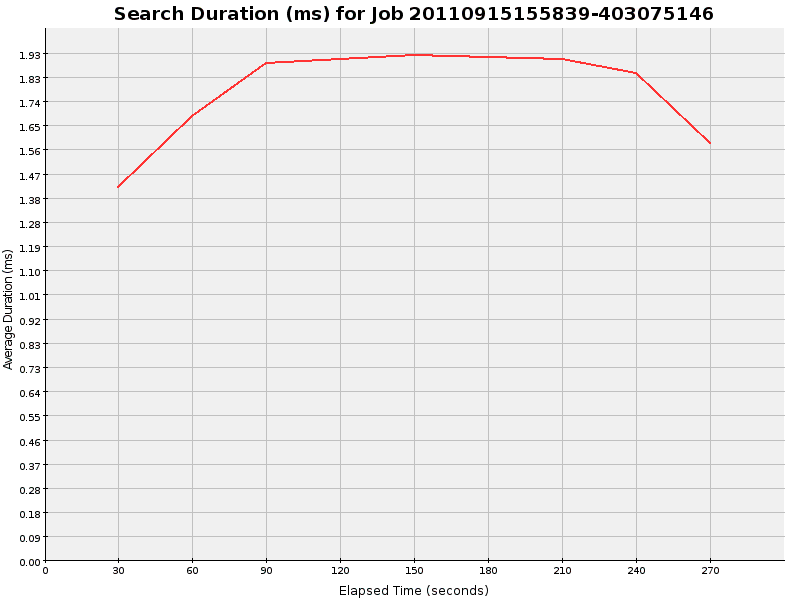
| Total Duration | Total Count | Avg Duration | Max Duration | Min Duration | Avg Count/Interval | Avg Duration/Interval | Std Dev | Correlation Coefficient | Regression Equation | Horizontality T Score |
| 40936760 | 23198158 | 1.765 | 259 | 0 | 2577573.111 | 4548528.889 | 0.181 | 0.190 | y = 1.704 + 0.001x | 0.057 |
| Interval | Total Duration | Count | Average Duration | Occurrences/Second |
| 1 | 4546002 | 3206566 | 1.418 | 106885.533 |
| 2 | 4547970 | 2699021 | 1.685 | 89967.367 |
| 3 | 4548882 | 2413137 | 1.885 | 80437.900 |
| 4 | 4549143 | 2393902 | 1.900 | 79796.733 |
| 5 | 4549105 | 2373438 | 1.917 | 79114.600 |
| 6 | 4549206 | 2382307 | 1.910 | 79410.233 |
| 7 | 4549091 | 2392611 | 1.901 | 79753.700 |
| 8 | 4549258 | 2462184 | 1.848 | 82072.800 |
| 9 | 4548103 | 2874992 | 1.582 | 95833.067 |
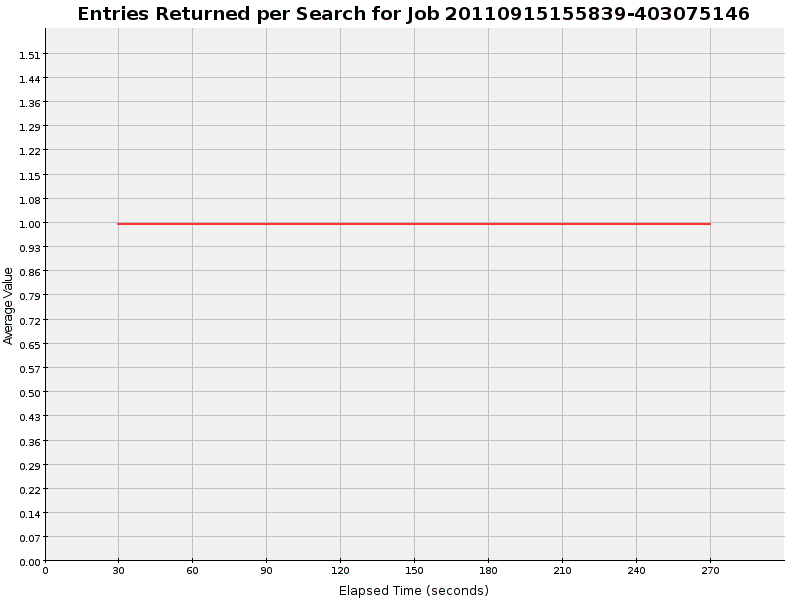
| Total | Avg Value | Max Value | Min Value | Avg/Second | Avg/Interval | Std Dev | Correlation Coefficient | Regression Equation | Horizontality T Score |
| 23198108 | 1.000 | 1 | 1 | 85918.919 | 2577567.556 | 0.000 | 0.000 | y = 1.000 + 0.000x | 0.085 |
| Interval | Total | Count | Average | Avg/Second |
| 1 | 3206534 | 3206534 | 1.000 | 106884.467 |
| 2 | 2699015 | 2699015 | 1.000 | 89967.167 |
| 3 | 2413148 | 2413148 | 1.000 | 80438.267 |
| 4 | 2393895 | 2393895 | 1.000 | 79796.500 |
| 5 | 2373444 | 2373444 | 1.000 | 79114.800 |
| 6 | 2382300 | 2382300 | 1.000 | 79410.000 |
| 7 | 2392618 | 2392618 | 1.000 | 79753.933 |
| 8 | 2462178 | 2462178 | 1.000 | 82072.600 |
| 9 | 2874976 | 2874976 | 1.000 | 95832.533 |
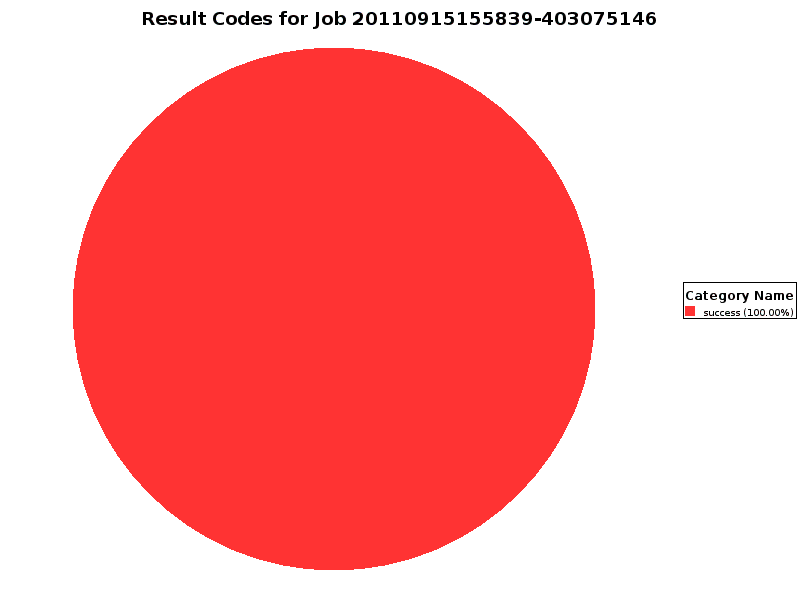
| Interval | success |
| Total | 23198110 (100.000%) |
| 0 | 3206535 (100.000) |
| 1 | 2699015 (100.000) |
| 2 | 2413148 (100.000) |
| 3 | 2393896 (100.000) |
| 4 | 2373443 (100.000) |
| 5 | 2382300 (100.000) |
| 6 | 2392618 (100.000) |
| 7 | 2462179 (100.000) |
| 8 | 2874976 (100.000) |